time series
时间序列数据就是随着时间发展变化(不变化)的数据
时间序列图
可以画共轴的子图,查看多个属性随时间变化的趋势
# Plot the time series in each dataset
fig, axs = plt.subplots(2, 1, figsize=(5, 10))
data.iloc[:1000].plot(y='data_values', ax=axs[0])
data2.iloc[:1000].plot(y='data_values', ax=axs[1])
plt.show()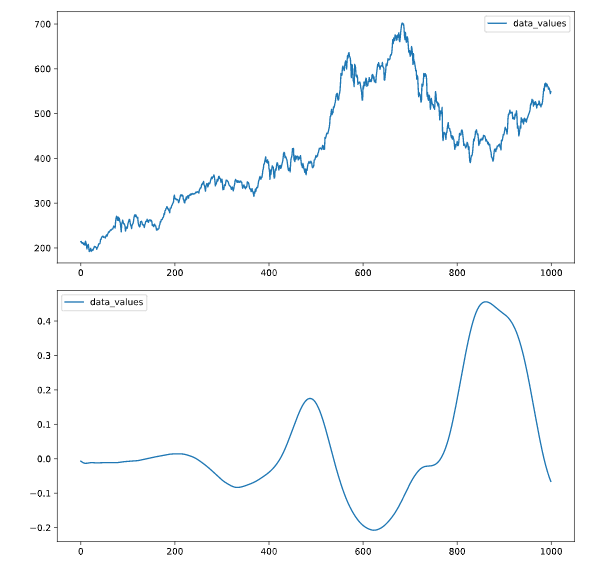
我再一次复习pd[[]]可以同时提取数据框的子集
*双中括号提取子列**
from sklearn.svm import LinearSVC

# Construct data for the model
X = data[["petal length (cm)" , "petal width (cm)"]]
y = data[['target']]

# Fit the model
model = LinearSVC()
model.fit(X, y)
还有就是想画在一个图的,公用y轴,如上述
reshape
给定数组或者数据框一个新的形状而不改变数据
predict
一般拟合完模型,进行预测,可直接使用predict