1 案例1:MySQL性能优化
1.1 问题
练习相关优化选项
启用慢查询日志
查看各种系统变量、状态变量
1.2 步骤
实现此案例需要按照如下步骤进行。
步骤一:mysql性能优化
1)查看服务运行时的参数配置
mysql> show variables\G;
......
*************************** 171. row ***************************
Variable_name: innodb_log_file_size
        Value: 50331648
*************************** 172. row ***************************
Variable_name: innodb_log_files_in_group
        Value: 2
*************************** 173. row ***************************
Variable_name: innodb_log_group_home_dir
        Value: ./
*************************** 174. row ***************************
Variable_name: innodb_log_write_ahead_size
        Value: 8192
*************************** 175. row ***************************
Variable_name: innodb_lru_scan_depth
        Value: 1024
*************************** 176. row ***************************
Variable_name: innodb_max_dirty_pages_pct
        Value: 75.000000
*************************** 177. row ***************************
Variable_name: innodb_max_dirty_pages_pct_lwm
        Value: 0.000000
*************************** 178. row ***************************
Variable_name: innodb_max_purge_lag
        Value: 0
......
mysql> show variables like "%innodb%";
+------------------------------------------+------------------------+
| Variable_name                            | Value                  |
+------------------------------------------+------------------------+
| ignore_builtin_innodb                    | OFF                    |
| innodb_adaptive_flushing                 | ON                     |
| innodb_adaptive_flushing_lwm             | 10                     |
| innodb_adaptive_hash_index               | ON                     |
| innodb_adaptive_hash_index_parts         | 8                      |
| innodb_adaptive_max_sleep_delay          | 150000                |
......
......
| innodb_undo_log_truncate                 | OFF                    |
| innodb_undo_logs                         | 128                     |
| innodb_undo_tablespaces                  | 0                      |
| innodb_use_native_aio                    | ON                     |
| innodb_version                           | 5.7.17                  |
| innodb_write_io_threads                  | 4                      |
+------------------------------------------+------------------------+
134 rows in set (0.01 sec)
2)并发连接数量
查看当前已经使用的连接数
mysql> flush status;
Query OK, 0 rows affected (0.00 sec)
mysql> show global status like "Max_used_connections";
+----------------------+-------+
| Variable_name        | Value |
+----------------------+-------+
| Max_used_connections | 3     |
+----------------------+-------+
1 row in set (0.00 sec)
查看默认的最大连接数
mysql> show variables like "max_connections%";
+-----------------+-------+
| Variable_name   | Value |
+-----------------+-------+
| max_connections | 151   |
+-----------------+-------+
1 row in set (0.00 sec)
3)连接超时时间
mysql> show variables like "%timeout%";
+-----------------------------+----------+
| Variable_name               | Value    |
+-----------------------------+----------+
| connect_timeout             | 10       |
| delayed_insert_timeout      | 300      |
| have_statement_timeout      | YES      |
| innodb_flush_log_at_timeout | 1        |
| innodb_lock_wait_timeout    | 50       |
| innodb_rollback_on_timeout  | OFF      |
| interactive_timeout         | 28800    |
| lock_wait_timeout           | 31536000 |
| net_read_timeout            | 30       |
| net_write_timeout           | 60       |
| rpl_stop_slave_timeout      | 31536000 |
| slave_net_timeout           | 60       |
| wait_timeout                | 28800    |
+-----------------------------+----------+
13 rows in set (0.00 sec)
4)允许保存在缓存中被重用的线程数量
mysql> show variables like "thread_cache_size";
+-------------------+-------+
| Variable_name     | Value |
+-------------------+-------+
| thread_cache_size | 9     |
+-------------------+-------+
1 row in set (0.00 sec)
5)用于MyISAM引擎的关键索引缓存大小
mysql> show variables like "key_buffer_size";
+-----------------+---------+
| Variable_name   | Value   |
+-----------------+---------+
| key_buffer_size | 8388608 |
+-----------------+---------+
1 row in set (0.00 sec)
6)为每个要排序的线程分配此大小的缓存空间
mysql> show variables like "sort_buffer_size";
+------------------+--------+
| Variable_name    | Value  |
+------------------+--------+
| sort_buffer_size | 262144 |
+------------------+--------+
1 row in set (0.00 sec)
7)为顺序读取表记录保留的缓存大小
mysql> show variables like "read_buffer_size";
+------------------+--------+
| Variable_name    | Value  |
+------------------+--------+
| read_buffer_size | 131072 |
+------------------+--------+
1 row in set (0.01 sec)
8)为所有线程缓存的打开的表的数量
mysql> show variables like "table_open_cache";
+------------------+-------+
| Variable_name    | Value |
+------------------+-------+
| table_open_cache | 2000  |
+------------------+-------+
1 row in set (0.00 sec)
步骤二:SQL查询优化
1)常用日志种类及选项,如图-1所示:

图-1
记录慢查询,图-2所示:
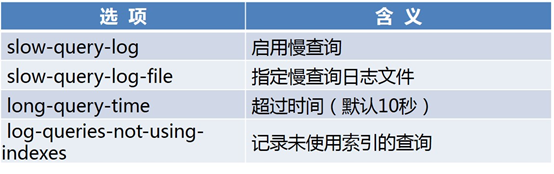
启用慢查询日志
[root@master10 ~]# vim /etc/my.cnf
...
slow_query_log=1
slow_query_log_file=mysql-slow.log
long_query_time=5
log_queries_not_using_indexes=1
...
[root@master10 ~]# systemctl restart mysqld
2)查看慢查询日志
[root@master10 ~]# mysqldumpslow  /var/lib/mysql/mysql-slow.log
Reading mysql slow query log from /var/lib/mysql/mysql-slow.log
Count: 1  Time=0.00s (0s)  Lock=0.00s (0s)  Rows=0.0 (0), 0users@0hosts
查看缓存的大小
mysql> show variables like "query_cache%";
+------------------------------+---------+
| Variable_name                | Value   |
+------------------------------+---------+
| query_cache_limit            | 1048576 |
| query_cache_min_res_unit     | 4096    |
| query_cache_size             | 1048576 |
| query_cache_type             | OFF     |
| query_cache_wlock_invalidate | OFF     |
+------------------------------+---------+
5 rows in set (0.00 sec)
3)查看当前的查询缓存统计
mysql> show global status like "qcache%";
+-------------------------+---------+
| Variable_name           | Value   |
+-------------------------+---------+
| Qcache_free_blocks      | 1       |
| Qcache_free_memory      | 1031832 |
| Qcache_hits             | 0       |
| Qcache_inserts          | 0       |
| Qcache_lowmem_prunes    | 0       |
| Qcache_not_cached       | 40      |
| Qcache_queries_in_cache | 0       |
| Qcache_total_blocks     | 1       |
+-------------------------+---------+
8 rows in set (0.00 sec)
