说到数据可视化绘图,我们先想到的应该是matplotlib库,可以对其中的
axes对象等调用不同的绘图方法(如axes.plot())。
作为数据分析用的pandas库提供了SeriesDataFrame等类型的对象,我们也可以调用上述对象来绘图(如Series.plot())。
本文将介绍这个库之间的关联,以及他们画图之间的异同。
1.关联
- Pandas库提供了
SeriesDataFrame等类型的对象,可以在matplotlib画图中作为数据来源放入参数中,如axes.plot(Series) - 可以对Pandas的对象调用画图方法,如
Series.plot(kind='line'),但说到底还是与matplotlib有关的,是pandas自动帮你生成了axes对象。 - 我们可以把Pandas画出来的图回传给指定的
axes对象,如Series.plot(kind='line', ax=ax1)就把这张折线图画在了ax1对象上。
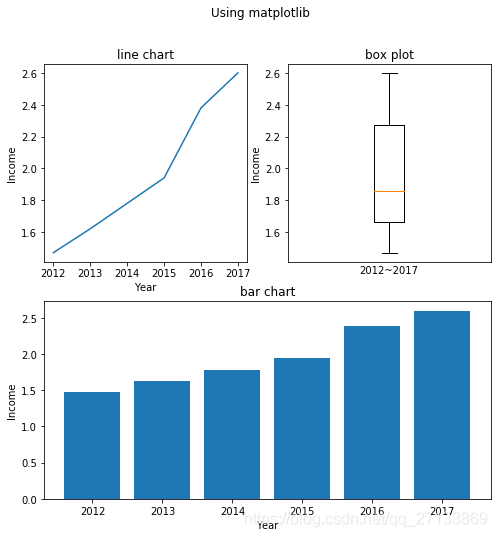
下面我将用matplotlib绘图和Pandas绘图两种方法画出同样的一张多子图图表
matplotlib方法:
import matplotlib.pyplot as plt
from pandas import Series
data = Series([1.47,1.62,1.78,1.94,2.38,2.60],index=['2012','2013','2014','2015','2016','2017'])
#实例化fig1对象
fig1=plt.figure(figsize=(8,8),facecolor='w')
#实例化ax对象
ax1 = fig1.add_subplot(2,2,1)
ax2 = fig1.add_subplot(2,2,2)
ax3 = fig1.add_subplot(2,1,2)
#ax对象画图
  #画ax1
ax1.plot(data)#注意对象名是ax1,它是matplotlib中的axes对象类型
ax1.set_title('line chart')
ax1.set_xlabel('Year')
ax1.set_ylabel('Income')
  #画ax2
ax2.boxplot(data)
ax2.set_xticks([])
ax2.set_title('box plot')
ax2.set_xlabel('2012~2017')
ax2.set_ylabel('Income')
  #画ax3
ax3.bar(data.index, data)
ax3.set_title('bar chart')
ax3.set_xlabel('Year')
ax3.set_ylabel('Income')
#设置fig1标题
fig1.suptitle('Using matplotlib')
Pandas方法:
import matplotlib.pyplot as plt
from pandas import Series
data = Series([1.47,1.62,1.78,1.94,2.38,2.60],index=['2012','2013','2014','2015','2016','2017'])
#实例化fig1对象
fig2=plt.figure(figsize=(8,8),facecolor='w')
#实例化ax对象
ax4 = fig2.add_subplot(2,2,1)
ax5 = fig2.add_subplot(2,2,2)
ax6 = fig2.add_subplot(2,1,2)
#用pandas绘图并将图像回传给ax对象
  #画ax4
data.plot(kind='line',ax=ax4)#注意对象名是data,它是Pandas中的Series对象类型
ax4.set_title('line chart')
ax4.set_xlabel('Year')
ax4.set_ylabel('Income')
  #画ax5
data.plot(kind='box',ax=ax5)
ax5.set_xticks([])
ax5.set_title('box plot')
ax5.set_xlabel('2012~2017')
ax5.set_ylabel('Income')
  #画ax6
data.plot(kind='bar',ax=ax6)
ax6.set_title('bar chart')
ax6.set_xlabel('Year')
ax6.set_ylabel('Income')
#设置fig2标题
fig2.suptitle('Using Pandas')
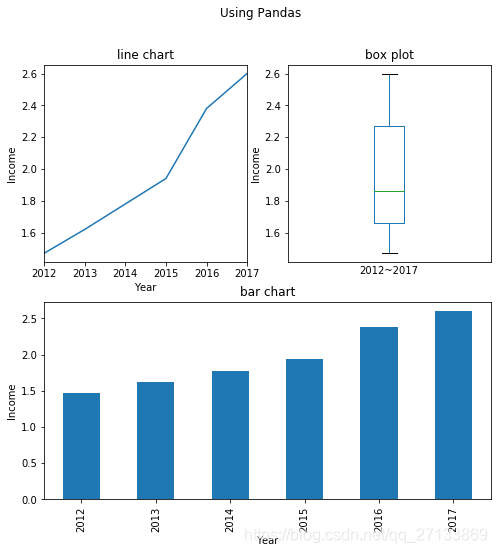
由上面的两个例子可以看出调用Pandas绘图和调用matplotlib绘图很多时候可以达到相同的效果
2.不同点
仔细分析画柱状图的两个语句ax3.bar(data.index, data)和data.plot(kind='bar',ax=ax6)
会发现在调用ax3画图的时候bar()方法里面有两个参量data.index和data,分别是这张图的x轴类别和y轴高度。
而用pandas画图的时候,我们只用把data对象放在前面,它就能自动识别出data里面的index和value。
从上面也可以看出来,对于用Series DataFrame这些用Pandas对象封装的多维的数据,调用Pandas绘图会有更方便和更好的支持。
下面再举一例:
我们有一个DataFrame类型的人员信息表格,每一行包含一个人的性别,收入等信息。现在我要按照性别分类,画出女性的收入的箱线图和男性收入的箱线图:
import pandas as pd
df = pd.read_csv('Data/bank-data.csv',index_col=0)
df
| age | sex | region | income | married | children | car | save_act | current_act | mortgage | pep | |
|---|---|---|---|---|---|---|---|---|---|---|---|
| id | |||||||||||
| ID12101 | 48 | FEMALE | INNER_CITY | 17546.00 | NO | 1 | NO | NO | NO | NO | YES |
| ID12102 | 40 | MALE | TOWN | 30085.10 | YES | 3 | YES | NO | YES | YES | NO |
| ID12103 | 51 | FEMALE | INNER_CITY | 16575.40 | YES | 0 | YES | YES | YES | NO | NO |
| ID12104 | 23 | FEMALE | TOWN | 20375.40 | YES | 3 | NO | NO | YES | NO | NO |
| ID12105 | 57 | FEMALE | RURAL | 50576.30 | YES | 0 | NO | YES | NO | NO | NO |
| ... | ... | ... | ... | ... | ... | ... | ... | ... | ... | ... | ... |
| ID12696 | 61 | FEMALE | INNER_CITY | 47025.00 | NO | 2 | YES | YES | YES | YES | NO |
| ID12697 | 30 | FEMALE | INNER_CITY | 9672.25 | YES | 0 | YES | YES | YES | NO | NO |
| ID12698 | 31 | FEMALE | TOWN | 15976.30 | YES | 0 | YES | YES | NO | NO | YES |
| ID12699 | 29 | MALE | INNER_CITY | 14711.80 | YES | 0 | NO | YES | NO | YES | NO |
| ID12700 | 38 | MALE | TOWN | 26671.60 | NO | 0 | YES | NO | YES | YES | YES |
600 rows × 11 columns
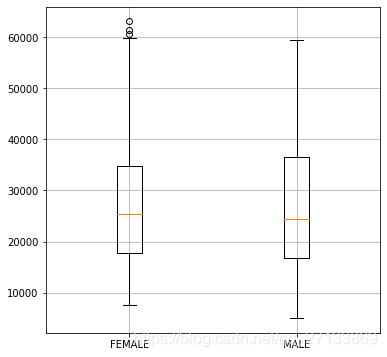
如果要用matplotlib绘图的话,就必须对DataFrame进行有条件的筛选切片,选出来所有女性的income列和男性的income列,然后再画箱线图:
fig7 = plt.figure(figsize=(6,6),facecolor='w')
ax7 = plt.axes()
ax7.boxplot( (df.loc[df['sex']=='FEMALE', 'income'], df.loc[df['sex']=='MALE', 'income']),
            labels=('FEMALE','MALE'))
ax7.grid()
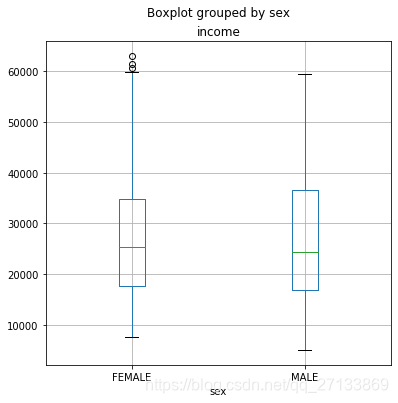
如果使用Pandas绘图的话,只需以df作为对象放在前面,调用boxplot()方法,并将'income',by='sex'填入参数里即可,相当于是Pandas自动帮你切片出income这一列,并以sex归类聚合了,比调用matplotlib方便不少,也直观很多:
fig8 = plt.figure(figsize=(6,6),facecolor='w')
ax8 = plt.axes()
df.boxplot('income', by='sex',ax=ax8)#对于多类别,需要聚合的数据,用pandas调用绘图要比axex调用绘图来得方便
3.总结
在大多数情况下我们可以选择Pandas绘图和matplotlib绘图去实现同样的功能,他们之间也有千丝万缕的联系。
在一些用Pandas封装的多维的数据(如DataFrame),调用Pandas绘图会有更方便和更好的支持,免去了手动切片、聚合数据等麻烦。
觉得有用的话,不要吝惜评论点赞分享哦,希望大家多多包涵,有任何问题欢迎指正、讨论。
本文基于CC-BY-SA 4.0协议,欢迎转载
(博客看累了?去我的B站瞧一瞧?)
