<!DOCTYPE html>
<html lang="en">
<head>
<meta charset="UTF-8">
<meta name="viewport" content="width=device-width, initial-scale=1.0">
<meta http-equiv="X-UA-Compatible" content="ie=edge">
<title>Document</title>
</head>
<body>
<canvas id="canvas"></canvas>
<script>
window.onload = function() {
const canvas = document.querySelector("#canvas");
const context = canvas.getContext('2d');
canvas.width = 400;
canvas.height = 400;
const ORIGIN_X = 200; // 原点横坐标
const ORIGIN_Y = 200; // 原点纵坐标
const BG_STROKE_COLOR = "rgb(121,121,121)"; // 背景填充的颜色连线的颜色
const BG_FILL_COLOR = "rgb(242,242,242)"; // 背景
const RADIUS = 56; // 图形的最外层半径
const RING_NUMS = 4; // 图形的环数
const FULL_VALUE = 100; // 数据的满值
const FONT_COLOR = "rgb(121,121,121)"; // 文字颜色
const POWER_BG_COLOR = "rgba(0,121,121,.4)"; // 能力图背景填充颜色
const POWER_POINT_COLOR = "rgb(0,121,121)"; // 能力图点的颜色
const POWER_STROKE_COLOR = "rgb(0,121,121)"; // 能力图连线的颜色
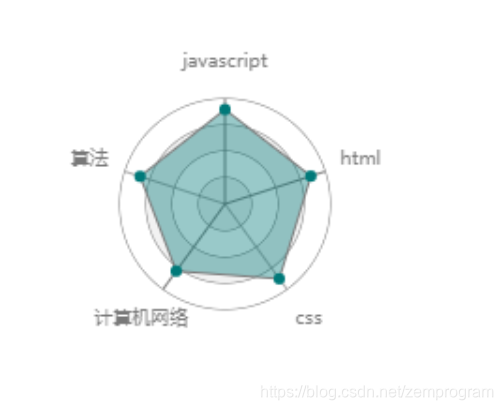
let data = [{
name: "javascript",
value: 90
}, {
name: "html",
value: 86
}, {
name: "css",
value: 88
}, {
name: "计算机网络",
value: 79
}, {
name: "算法",
value: 85
}]
// 绘制环形背景 参数为环形中心横坐标,纵坐标,环形最外层半径,环数,数据,线条颜色,填充颜色
CanvasRenderingContext2D.prototype.drawRing = function(x, y, r, ringNum, data, strokeColor = "rgba(0,0,0)", fillColor = "rgb(242,242,242)") {
const PER_RADIUS = r / ringNum;
for (let i = ringNum; i > 0; i--) {
this.beginPath();
this.strokeStyle = strokeColor;
if (i % 2 === 0) {
this.arc(x, y, PER_RADIUS * i, 0, 2 * Math.PI);
this.fillStyle = "rgb(255,255,255)";
this.stroke();
this.fill();
} else {
this.arc(x, y, PER_RADIUS * i, 0, 2 * Math.PI);
this.fillStyle = fillColor;
this.stroke();
this.fill();
}
this.closePath();
}
const PER_ANGLE = 2 * Math.PI / data.length;
for (let i = 0; i < data.length; i++) {
this.beginPath();
this.strokeStyle = strokeColor;
this.moveTo(x, y);
this.lineTo(x + r * Math.sin(PER_ANGLE * i), y - r * Math.cos(PER_ANGLE * i));
this.stroke();
this.closePath();
}
}
// 绘制能力形状 参数为环形中心横坐标,纵坐标,环形最外层半径,数据,能力图线条颜色,能力图填充颜色,能力图点颜色,满值
CanvasRenderingContext2D.prototype.drawPowerShape = function(x, y, r, data, strokeColor, fillColor, pointColor, fullValue = FULL_VALUE) {
if (!data || data.length < 3) {
throw new Error("An array with a length of more than 3 should be passed as the parameter")
}
this.beginPath();
const PER_ANGLE = 2 * Math.PI / data.length;
for (let i = 0; i < data.length; i++) {
const DATA_RADIUS = data[i].value / fullValue * r;
new Promise(resolve => {
this.lineTo(x + DATA_RADIUS * Math.sin(PER_ANGLE * i), y - DATA_RADIUS * Math.cos(PER_ANGLE * i))
resolve(DATA_RADIUS);
}).then(radius => { // 通过promise异步保证点的绘制在能力图背景的绘制之后
this.beginPath();
this.arc(x + radius * Math.sin(PER_ANGLE * i), y - radius * Math.cos(PER_ANGLE * i), 3, 0, Math.PI * 2);
this.fillStyle = pointColor;
this.fill();
this.closePath();
})
}
this.lineTo(x, y - data[0].value / fullValue * r)
this.fillStyle = fillColor;
this.strokeColor = strokeColor;
this.fill();
this.stroke();
this.closePath();
}
// 绘制文字 参数为环形中心横坐标,纵坐标,文字绘制起点所在圆半径,数据,文字颜色
CanvasRenderingContext2D.prototype.drawText = function(x, y, r, data, fontColor = "rgb(121,121,121)") {
if (!data || data.length < 3) {
throw new Error("An array with a length of more than 3 should be passed as the parameter")
}
const PER_ANGLE = 2 * Math.PI / data.length;
this.fillStyle = fontColor
for (let i = 0; i < data.length; i++) {
this.beginPath();
this.textAlign = "center";
this.textBaseline = "middle";
this.font = "10px Adobe Ming Std";
this.fillText(data[i].name, x + r * Math.sin(PER_ANGLE * i), y - r * Math.cos(PER_ANGLE * i));
this.fill();
this.closePath();
}
}
context.drawRing(ORIGIN_X, ORIGIN_Y, RADIUS, RING_NUMS, data, BG_STROKE_COLOR, BG_FILL_COLOR);
context.drawPowerShape(ORIGIN_X, ORIGIN_Y, RADIUS, data, POWER_STROKE_COLOR, POWER_BG_COLOR, POWER_POINT_COLOR);
context.drawText(ORIGIN_X, ORIGIN_Y, RADIUS + 20, data, FONT_COLOR)
}
</script>
</body>
</html>
只要修改data数据和相应的颜色就可以修改能力图了,上面例子效果如下