目录
1、说明
2、Series对象的绘图技巧
3、DataFrame对象的绘图技巧
1、说明
Series与DataFrame类型的对象也支持图形绘制,使用对象的plot方法即可。如果绘图数据就存在Series或者DataFrame对象中,我们就可以直接绘制,而无需使用plt.plot。
直接使用Series与DataFrame对象的plot方法绘图,有时候会显得特别方便,尤其是绘制一些简单的图形的时候,很nice!
注意:当利用Series与DataFrame对象的plot方法绘出某个图形后,仍然可以使用matplotlib中的各种绘图参数,来美化自己的图形。
2、Series对象的绘图技巧
1)常用图形绘制
plot默认绘制的是线形图,但是我们可以通过调整其kind参数的值,来绘制其它不同类型的图形。
① 常用图类型
- line:线形图
- bar:柱形图
- barh:条形图
- hist:直方图
- kde / density:核密度图
- pie:饼图
- box:箱线图
- area:面积图
② 常用参数
- color
- alpha
- stacked:是否堆叠。
③ 两种语法格式
- 格式一:s.plot(kind=“图类型”)
- 举例如下:s.plot(kind=“line”)
- 格式二:s.plot.图类型()
- 举例如下:s.plot.line()
操作如下:
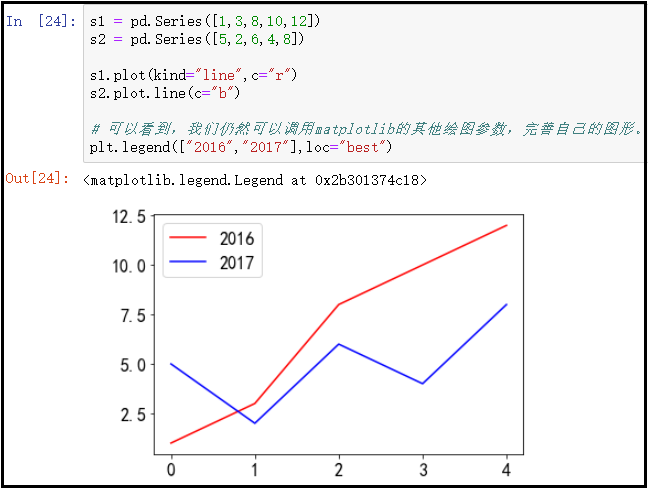
s1 = pd.Series([1,3,8,10,12])
s2 = pd.Series([5,2,6,4,8])

s1.plot(kind="line",c="r")
s2.plot.line(c="b")

# 可以看到,我们仍然可以调用matplotlib的其他绘图参数,完善自己的图形。
plt.legend(["2016","2017"],loc="best")
结果如下:
2)案例操作
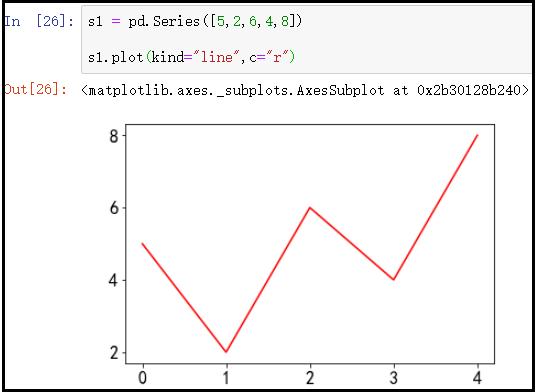
① 绘制折线图
s1 = pd.Series([5,2,6,4,8])

s1.plot(kind="line",c="r")
结果如下:
② 绘制柱形图(又叫条形图)
s1 = pd.Series([5,2,6,4,8])

s1.plot.bar(color="b")

# 当没有这句代码时,横坐标是“睡着”的,因此调整一下横坐标标签的方向。
plt.xticks(rotation=360)
结果如下:

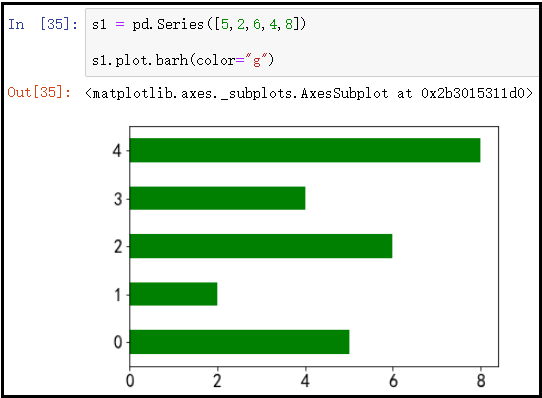
③ 绘制水平柱形图(条形图)
s1 = pd.Series([5,2,6,4,8])

s1.plot.barh(color="g")
结果如下:
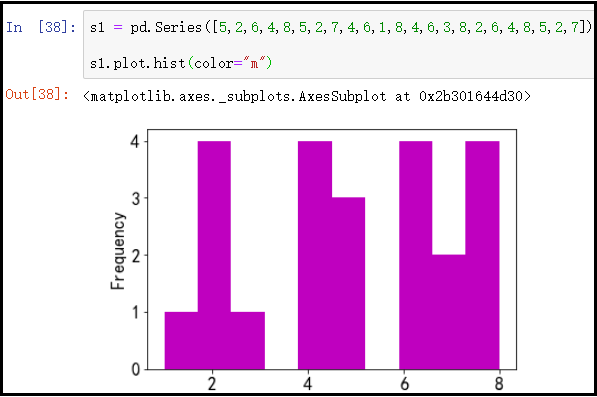
④ 绘制直方图
s1 = pd.Series([5,2,6,4,8,5,2,7,4,6,1,8,4,6,3,8,2,6,4,8,5,2,7])

s1.plot.hist(color="m")
结果如下:
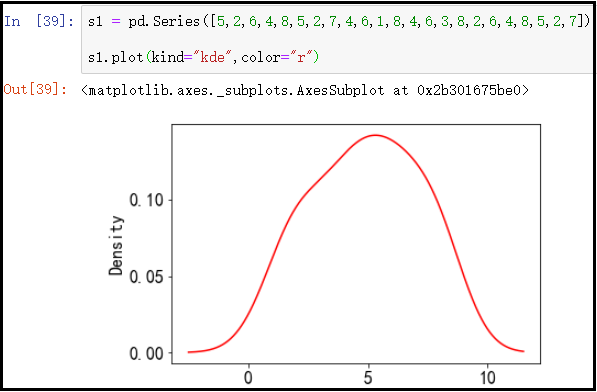
⑤ 绘制核密度图
s1 = pd.Series([5,2,6,4,8,5,2,7,4,6,1,8,4,6,3,8,2,6,4,8,5,2,7])

s1.plot(kind="kde",color="r")
结果如下:
⑥ 绘制饼图
s1 = pd.Series([1,1,2,2,3])
# 求出Series中每个元素的占比
s1 = s1.value_counts()/s1.shape
display(s1)

s1.plot(kind="pie")
plt.axis("equal")
结果如下:

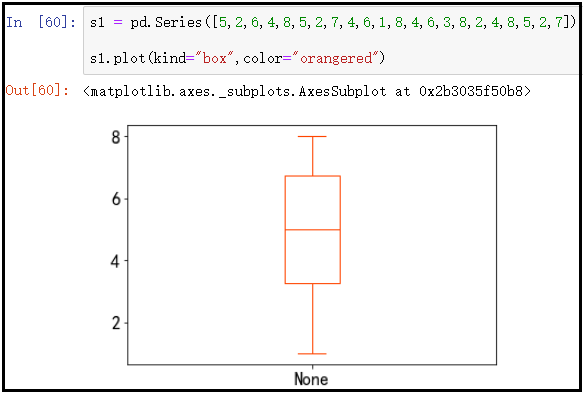
⑦ 绘制箱线图
s1 = pd.Series([5,2,6,4,8,5,2,7,4,6,1,8,4,6,3,8,2,4,8,5,2,7])

s1.plot(kind="box",color="r")
结果如下:
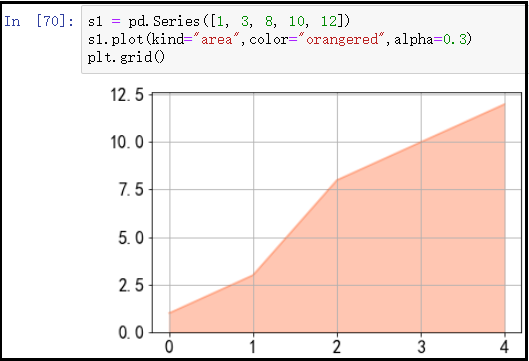
⑧ 绘制面积图
s1 = pd.Series([1, 3, 8, 10, 12])
s1.plot(kind="area",color="orangered",alpha=0.3)
plt.grid()
结果如下:
3、DataFrame对象的绘图技巧
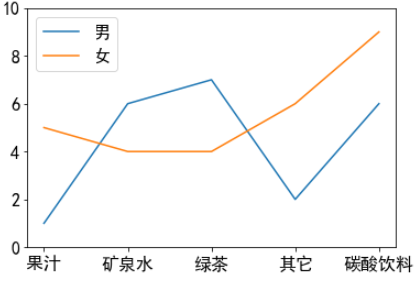
① 绘制折线图
df = pd.read_excel(r"C:\Users\黄伟\Desktop\matplotlib.xlsx",
                   sheet_name="柱形图1")

df1.plot(kind="line")

plt.ylim(0,10)
plt.xticks(np.arange(0,5),["果汁","矿泉水","绿茶","其它","碳酸饮料"])
结果如下:
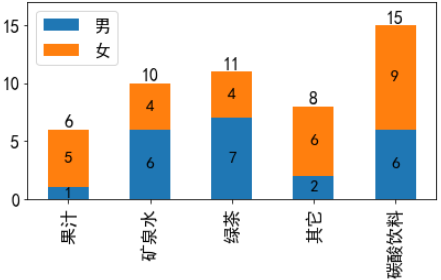
② 绘制条形图
df = pd.read_excel(r"C:\Users\黄伟\Desktop\matplotlib.xlsx",
                   sheet_name="柱形图1")

df1.plot(kind="bar",stacked=True)

plt.ylim(0,17)
plt.xticks(np.arange(0,5),["果汁","矿泉水","绿茶","其它","碳酸饮料"])

for x,y in enumerate(df["男"]):
    plt.text(x,y/2-0.5,y,ha="center",va="bottom",fontsize=15)

for x,y in enumerate(df["女"]):
    plt.text(x,y/2+df["男"][x]-0.5,y,ha="center",va="bottom",fontsize=15)

for xy1 in enumerate(df["男"]+df["女"]):
    plt.annotate("{}".format(xy1[1]),xy=xy1,ha="center",va="bottom")

plt.tight_layout()
plt.savefig("不同饮料类型的男、女人数的堆积条形图",dpi=300)
结果如下:
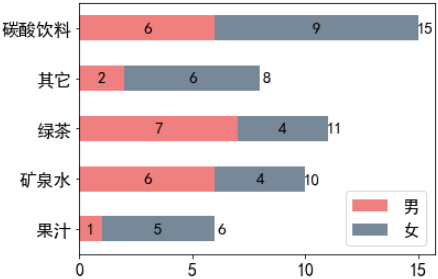
③ 绘制水平堆积条形图
df = pd.read_excel(r"C:\Users\黄伟\Desktop\matplotlib.xlsx",
                   sheet_name="柱形图1")

df.plot(kind="barh", stacked=True,color=['lightcoral','lightslategrey'])

for x,y in enumerate(df["男"]):
    plt.text(y/2,x,y,ha="center",va="center",fontsize=15)

for x,y in enumerate(df["女"]):
    plt.text(y/2+df["男"][x],x,y,ha="center",va="center",fontsize=15)

for x,y in enumerate(df["男"]+df["女"]):
    plt.text(y+0.3,x,y,ha="center",va="center",fontsize=15)

plt.yticks(np.arange(0,5),["果汁","矿泉水","绿茶","其它","碳酸饮料"])

plt.tight_layout()
plt.savefig("不同饮料类型的男、女人数的水平堆积条形图",dpi=300)
结果如下:
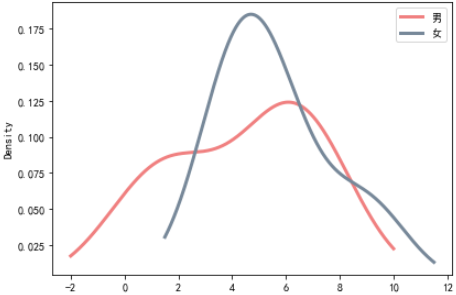
④ 绘制核密度图
df = pd.read_excel(r"C:\Users\黄伟\Desktop\matplotlib.xlsx",
                   sheet_name="柱形图1")
df1 = df[["男","女"]]

df1.plot(kind="kde",color=['lightcoral','lightslategrey'],lw=3)

plt.tight_layout()
plt.savefig("不同饮料类型的男、女人数的核密度图",dpi=300)
结果如下:
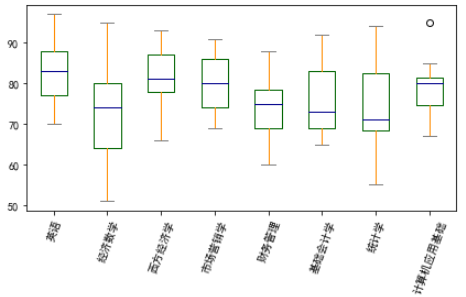
⑤ 绘制箱线图
df = pd.read_excel(r"C:\Users\黄伟\Desktop\matplotlib.xlsx",
                   sheet_name="箱线图")
df1 = df.iloc[:,1:]

f = df1.plot(kind="box",showfliers = True,
         color = dict(boxes='DarkGreen',whiskers='DarkOrange',medians='DarkBlue',caps='Gray'))

plt.xticks(rotation=70,fontproperties = 'simhei')

plt.tight_layout()
plt.savefig("8门课程考试成绩的箱线图",dpi=300)
结果如下:
详细参数,可以查看该文章:https://blog.csdn.net/weixin_30935137/article/details/80685957
⑥ 绘制面积图
df = pd.read_excel(r"C:\Users\黄伟\Desktop\matplotlib.xlsx",
                   sheet_name="面积图")
display(df.T)
df = df.T

df.plot(kind="area",figsize=(6,5))

plt.xticks(np.arange(3),["2018年","2019年","2020年"])
plt.yticks(np.arange(0,15001,5000))
结果如下:

关于面积图的解释:面积图是在折线图的基础之上形成的,它将折线图中折线与坐标轴之间的区域,使用颜色进行填充,这个填充就是我们所说的面积,颜色的填充可以更好地突出趋势信息。和折线图一样,面积图强调数量随着时间变化的程度。
