一般我们为了确保系统的稳健运行,都会对系统运行时的各个指标进行收集,如CPU使用率,内存使用率,磁盘IO,网络延迟,应用心跳等。进行实时监控,通过对这些数据的监控,使我们能够在出现问题时第一时间通知开发/运维人员进行处理,或者触发某些自动化操作,以确保在用户还没有察觉到问题之前处理完故障和异常,以系统的稳定运行。
想必大家都已经知道,在Azure中,我们可以使用Azure Monitor来对系统的指标进行监控。所以今天我们就和大家聊聊如何如何使用Azure Monitor来监控系统的CPU使用率。
先觉条件
和前面监控服务和进程的状态类似,使用Azure Monitor监控系统的性能指标我们需要在服务器上安装Log Analytics代理。至于具体怎么安装,大家可以参考我之前的博客:https://blog.51cto.com/wuyvzhang/2470702
除此之外,我们还要启用额外的数据源,在我们今天的博客中将是性能计数器。
如果我们之前没有启用性能计数器数据,则可以在Log Analytics Workspace中单击“ 高级设置”,再单击“ 数据”,现在单击“ Windows性能计数器”,最后单击“ 添加选定的性能计数器”: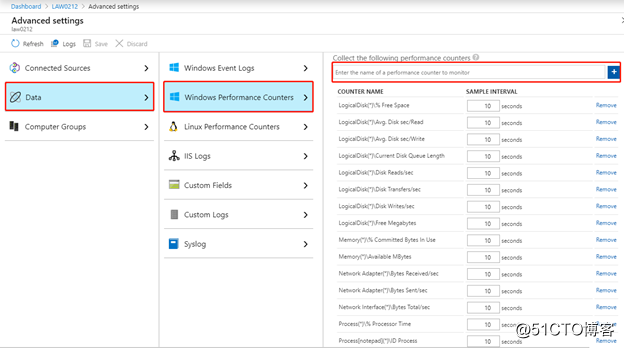
查询收集到的数据
我们可以使用如下查询语句从我们收集到的数据中查询出系统的CPU使用率:
Perf
| where ObjectName == "Processor" and CounterName == "% Processor Time" and InstanceName == "_Total" and Computer in ((Heartbeat
| distinct Computer))
| summarize PCT95CPUPercentTime = percentile(CounterValue, 95) by Computer
| summarize max(PCT95CPUPercentTime) by Computer
| join
(
Perf
| where ObjectName == "Processor" and CounterName == "% Processor Time" and InstanceName == "_Total" and Computer in ((Heartbeat
| distinct Computer))
)
on Computer
| make-series PCT95CPUPercentTime = percentile(CounterValue, 95) on TimeGenerated from ago( 5h ) to now() step 10m by Computer
| render timechart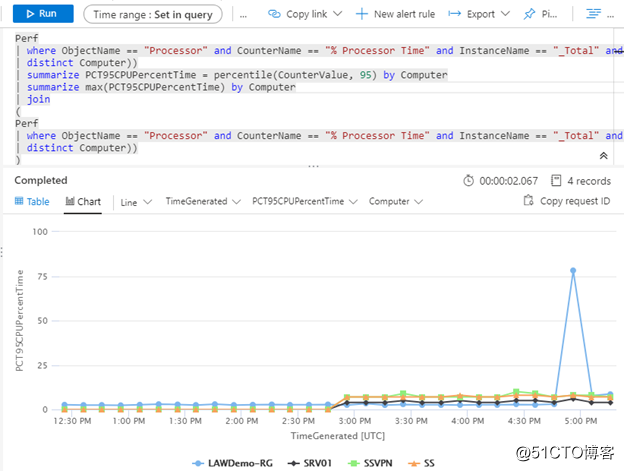
也可以使用如下语句来查看CPU使用率大于某个值的机器:
let setpctValue = 3;
Perf
| where ObjectName == "Processor" and CounterName == "% Processor Time" and InstanceName == "_Total" and Computer in ((Heartbeat
| distinct Computer))
| summarize PCT95CPUPercentTime = percentile(CounterValue, 95) by Computer
| where PCT95CPUPercentTime > setpctValue
| summarize max(PCT95CPUPercentTime) by Computer
| join
(
Perf
| where ObjectName == "Processor" and CounterName == "% Processor Time" and InstanceName == "_Total" and Computer in ((Heartbeat
| distinct Computer))
)
on Computer
| make-series PCT95CPUPercentTime = percentile(CounterValue, 95) on TimeGenerated from ago( 5h ) to now() step 10m by Computer
| render timechart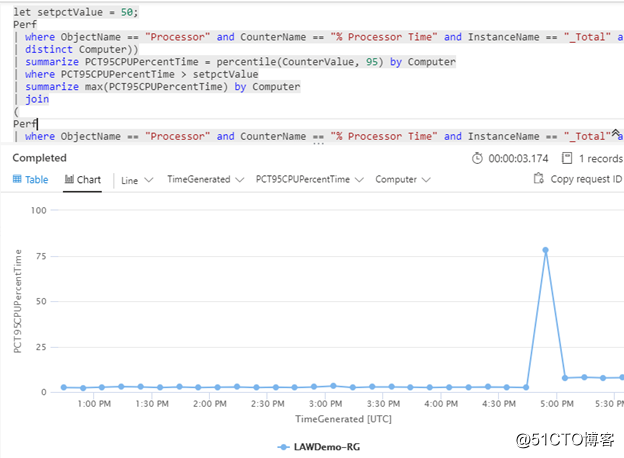
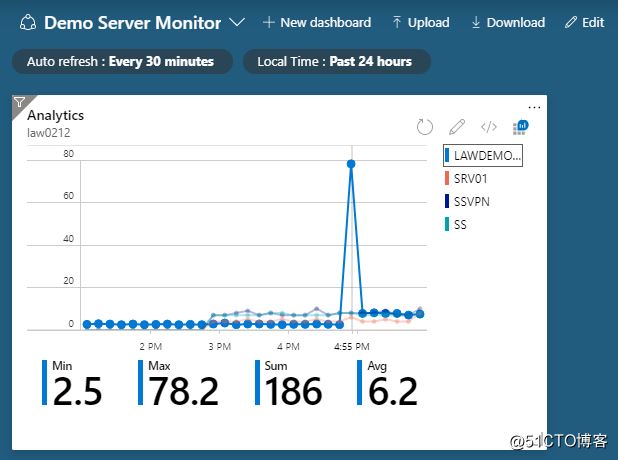
将性能图表固定到仪表板
若想将我们所查询出来的图表固定到Azure Dashboard,可以点击查询窗口右上方的“固定”按钮,然后选择我们要将图标展示在那个Dashboard。