本文转载运维@小兵 原文地址:
https://blog.csdn.net/anqixiang/article/details/104166077
一、简介
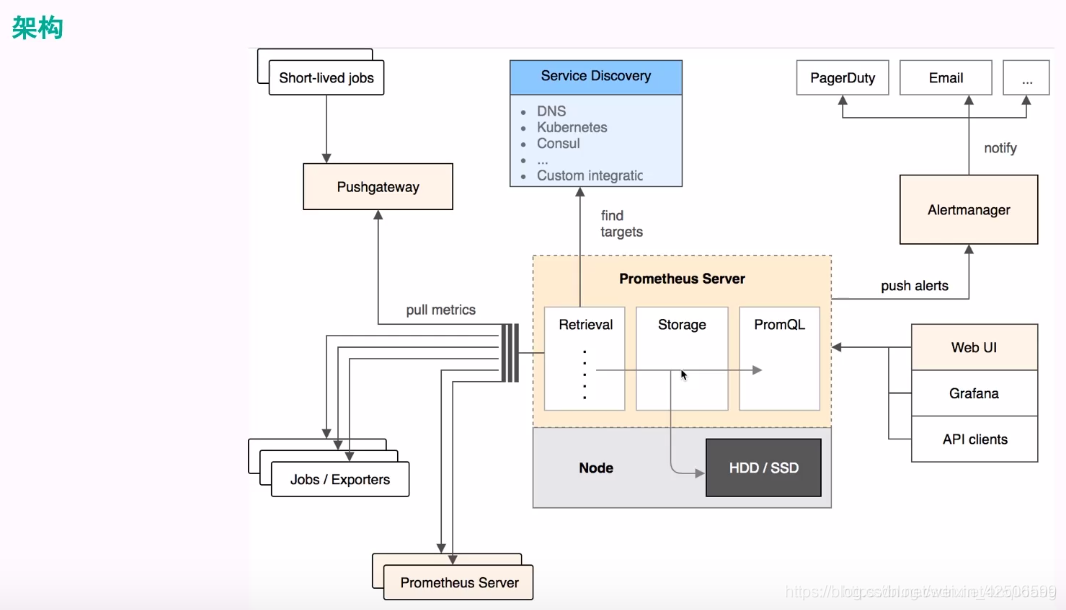
1架构图
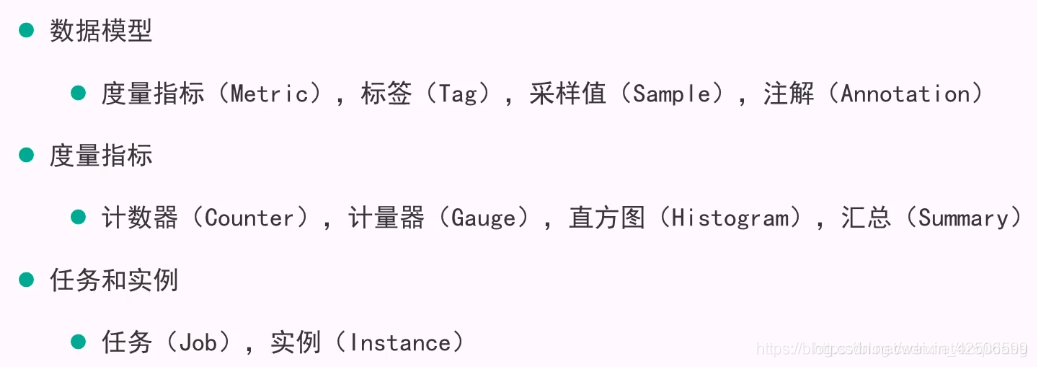
2、核心概念
二、安装配置和使用
下载二进制包并解压
官方地址:https://github.com/prometheus/prometheus/tags
**百度网盘 :**链接:https://pan.baidu.com/s/1og-EH5nxG9xX6ndVI-Gogg
提取码:q5in
tar xvf prometheus-2.14.0.linux-amd64.tar.gz
mv prometheus-2.14.0.linux-amd64 /usr/local/bin/prometheus
配置systemd管理
cat > /usr/lib/systemd/system/prometheus.service << EOF
[Unit]
Description=https://prometheus.io

[Service]
Restart=on-failure
ExecStart=/usr/local/bin/prometheus/prometheus --config.file=/usr/local/bin/prometheus/prometheus.yml

[Install]
WantedBy=multi-user.target
EOF
systemctl daemon-reload
systemctl start prometheus
systemctl enable prometheus
2.web访问(默认监控自身)
访问地址:http://ip:9090
3.查看当前抓取的数据
http://IP:9090/metrics

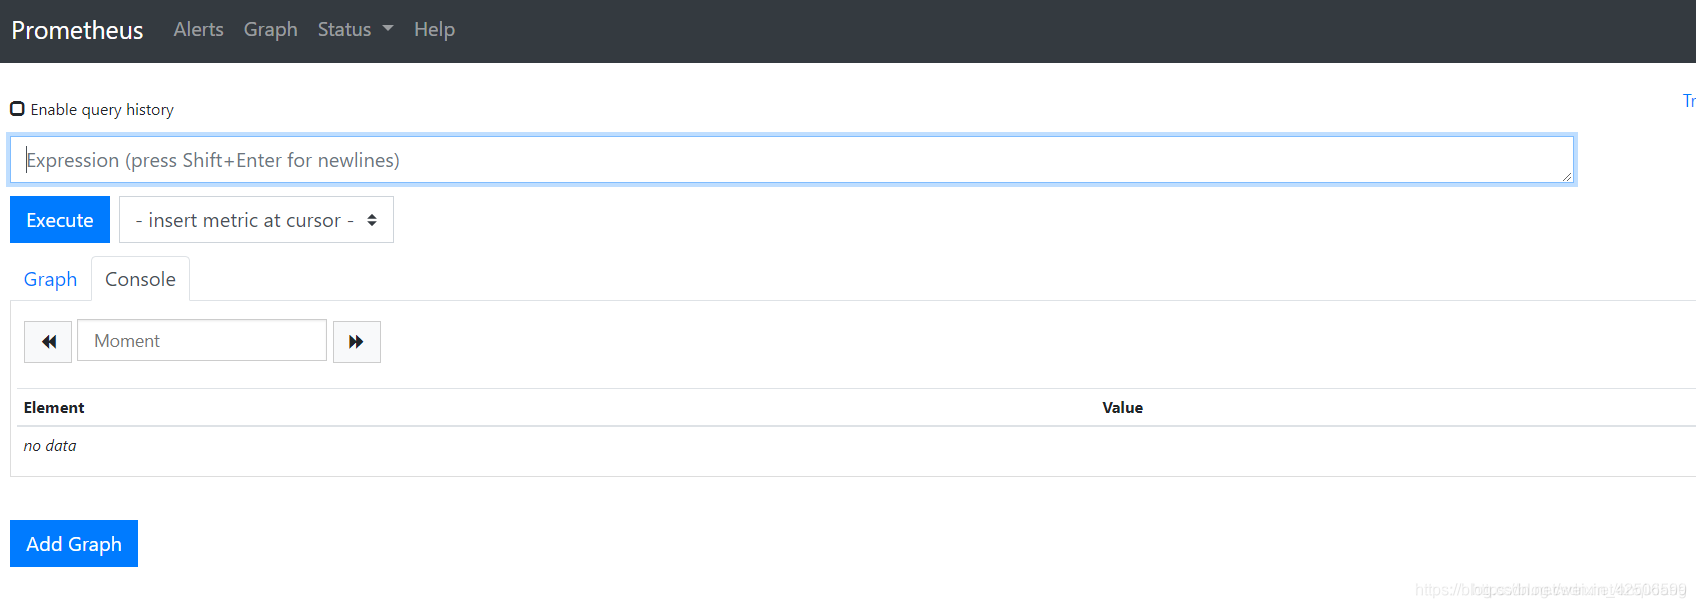
4.查找数据,示例
访问地址:http://ip:9090
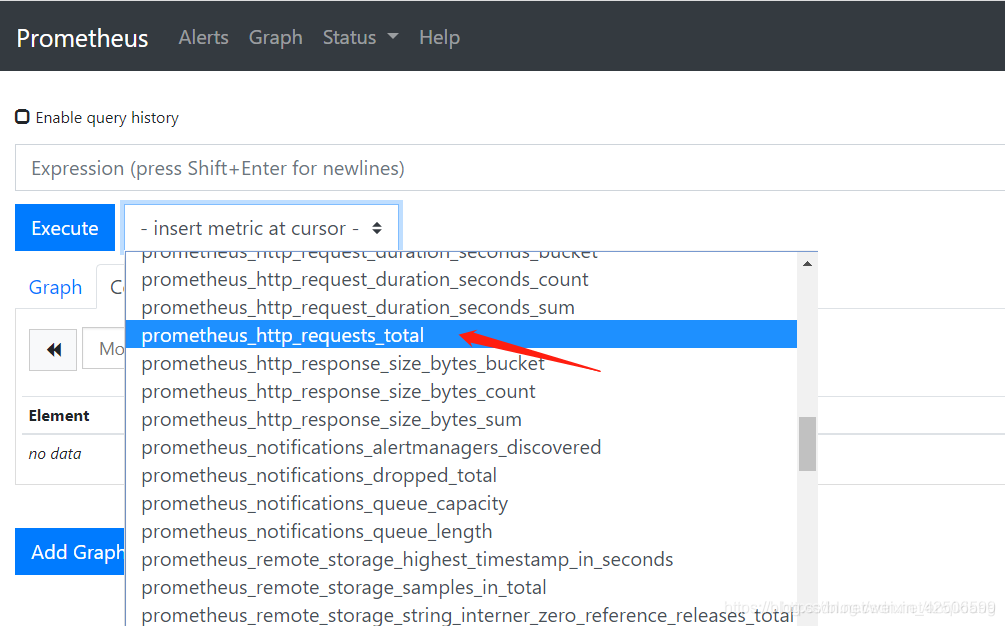
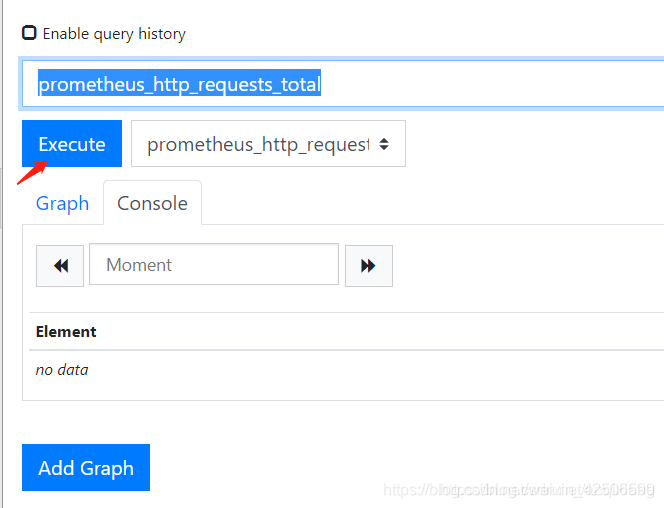
可以看到统计的数据

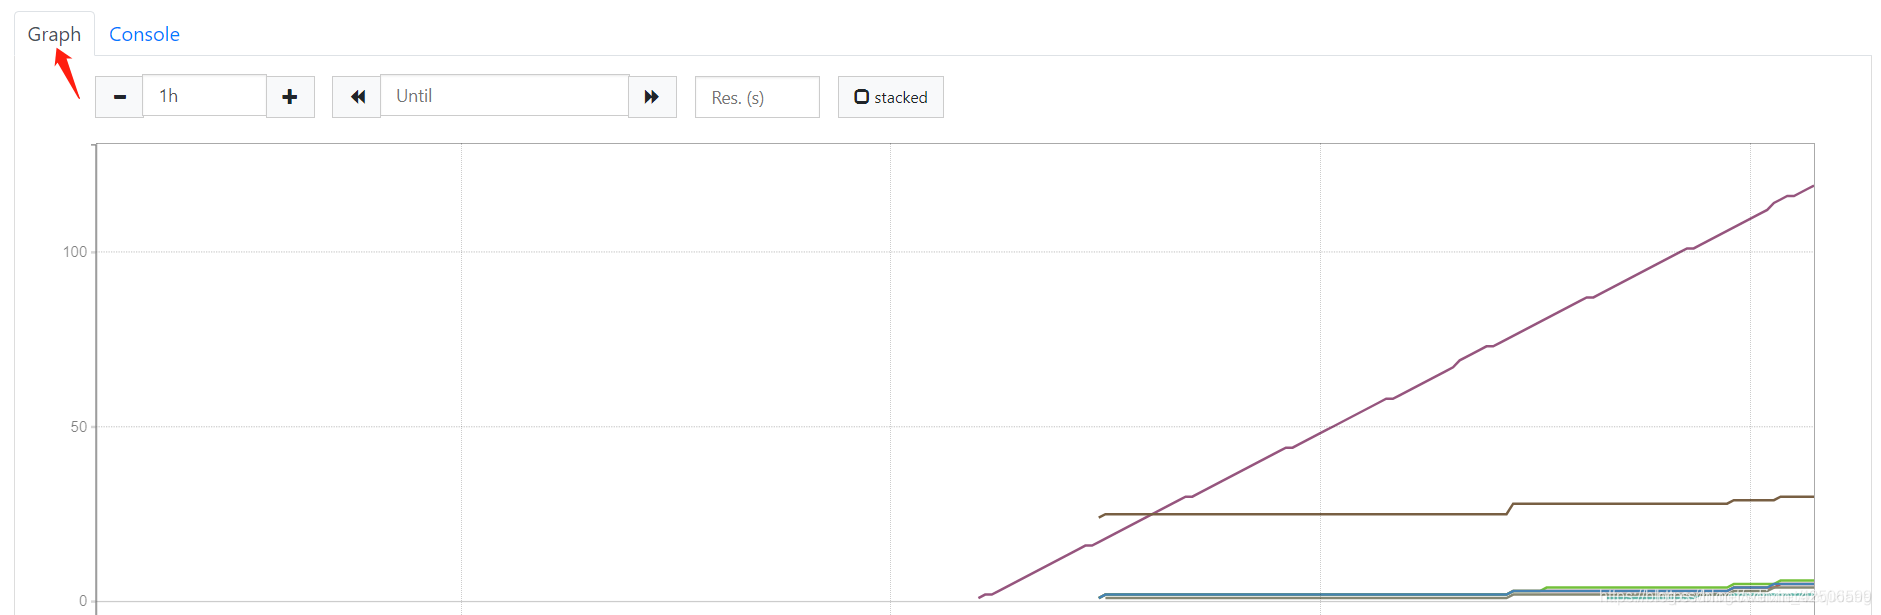
图形化展示
三、docker方式部署(没试验出来呢,卡在了02.拉取镜像)
1安装docker
wget https://mirrors.aliyun.com/docker-ce/linux/centos/docker-ce.repo -O /etc/yum.repos.d/docker-ce.repo
yum install docker-ce-18.06.1.ce-3.el7 -y
systemctl enable docker
systemctl start docker
docker -v
2拉取镜像启动容器
配置国内镜像源,提高下载速度:https://blog.csdn.net/anqixiang/article/details/96772479
docker run -d --name prometheus --restart=always -p 9090:9090 -v /usr/local/bin/prometheus/prometheus.yml:/etc/prometheus/prometheus.yml prom/prometheus
访问http://ip:9090
四、配置文件讲解

1、global全局配置
scrape_interval		采集数据周期,默认1分钟
scrape_timeout		采集超时时间,默认10秒
evaluation_interval	告警评估周期,默认1分钟
external_labels		外部标签,很少用
2、rule_files指定监控告警规则
参考:https://www.jianshu.com/p/fb5c82de935d
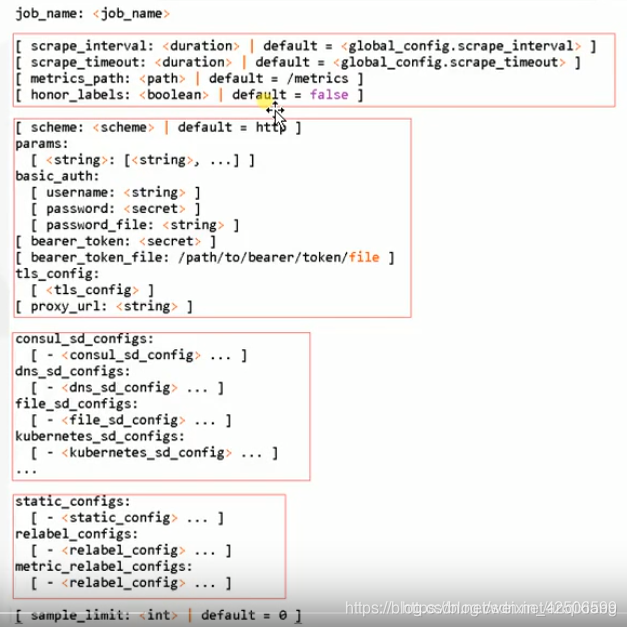
metrics_path		默认为/metrics
honor_labels		默认标签值,默认不覆盖
scheme:				请求的协议,默认http
params:				http携带的参数
basic_auth			基础认证
4.alerting配置告警
5.remote_write远程存储写
6.remote_read远程存储读
