一、简介
ELK是三个开源软件的缩写,分别表示:Elasticsearch , Logstash, Kibana
1、Elasticsearch是个开源分布式搜索引擎,提供搜集、分析、存储数据三大功能。
它的特点有:分布式,零配置,自动发现,索引自动分片,索引副本机制,restful风格接口,多数据源,自动搜索负载等。
2、Logstash 主要是用来日志的搜集、分析、过滤日志的工具,支持大量的数据获取方式。
一般工作方式为c/s架构,client端安装在需要收集日志的主机上,server端负责将收到的各节点日志进行过滤、修改等操作在一并发往elasticsearch上去。
3、Kibana可以为 Logstash 和 ElasticSearch 提供的日志分析友好的 Web 界面,可以帮助汇总、分析和搜索重要数据日志。
4、FileBeat,它是一个轻量级的日志收集处理工具(Agent),Filebeat占用资源少,适合于在各个服务器上搜集日志后传输给Logstash,官方也推荐此工具。
二、准备环境
 关闭防火墙、关闭selinux :
    systemctl stop firewalld.service
    setenforce 0
 两台centos7服务器 :
        10.0.0.32
        10.0.0.33
三、IP 10.0.0.32 上的操作:
上传压缩包 ELK.zip 并解压:
所需的安装包有:
	elasticsearch-6.6.2.rpm
    jdk-8u131-linux-x64_.rpm
    kibana-6.6.2-x86_64.rpm
开始部署:
1、安装jdk环境
[root@localhost ELK]# java -version
java version "1.8.0_131"
Java(TM) SE Runtime Environment (build 1.8.0_131-b11)
Java HotSpot(TM) 64-Bit Server VM (build 25.131-b11, mixed mode)
2、安装 elasticsearch
[root@localhost ELK]# yum -y install elasticsearch-6.6.2.rpm
Loaded plugins: fastestmirror
Repodata is over 2 weeks old. Install yum-cron? Or run: yum makecache fast
....
Installed:
  elasticsearch.noarch 0:6.6.2-1
Complete!
修改配置文件,取消注释,更改为自己的IP (10.0.0.32)
vim /etc/elasticsearch/elasticsearch.yml
   55 network.host: 10.0.0.32
   56 #
   57 # Set a custom port for HTTP:
   58 #
   59 http.port: 9200
保存退出,启动该服务
[root@localhost ELK]# systemctl daemon-reload
[root@localhost ELK]# systemctl enable elasticsearch.service
或
[root@localhost ELK]# systemctl restart elasticsearch.service
使用命令查看端口有没有起来;起不来要耐心等待一下
[root@localhost ELK]# ss -lntp|grep java
LISTEN     0      128       ::ffff:10.0.0.32:9200                    :::*                   users:(("java",pid=2528,fd=190))
LISTEN     0      128       ::ffff:10.0.0.32:9300                    :::*                   users:(("java",pid=2528,fd=182))
也可以通过日志查看
[root@localhost ELK]# tail -f /var/log/elasticsearch/elasticsearch.log
[2020-02-12T17:40:07,404][INFO ][o.e.g.GatewayService     ] [r7enYQG] recovered [0] indices into cluster_state
[2020-02-12T17:40:07,729][INFO ][o.e.c.m.MetaDataIndexTemplateService] [r7enYQG] adding template [.watches] for index patterns [.watches*]
3、启动完毕后,安装kibana
[root@localhost ELK]# yum -y install kibana-6.6.2-x86_64.rpm
...
Installed:
  kibana.x86_64 0:6.6.2-1
Complete!
修改配置文件 取消注释并修改
vim /etc/kibana/kibana.yml
   2 server.port: 5601
   7 server.host: "10.0.0.32"
   28 elasticsearch.hosts: ["http://10.0.0.32:9200"]
保存后退出,启动服务
[root@localhost ELK]# systemctl start kibana.service
查看端口:
[root@localhost ELK]# ss -lntp |grep 5601
LISTEN     0      128    10.0.0.32:5601
四、 IP 10.0.0.33上的操作
上传压缩包 ELK.zip 并解压:
所需的安装包有:
    jdk-8u131-linux-x64_.rpm
    logstash-6.6.0.rpm
开始部署:
1、安装jdk环境
[root@localhost ELK]# java -version
java version "1.8.0_131"
Java(TM) SE Runtime Environment (build 1.8.0_131-b11)
Java HotSpot(TM) 64-Bit Server VM (build 25.131-b11, mixed mode)
2、安装 logstash
[root@localhost ELK]# yum -y install logstash-6.6.0.rpm
Loaded plugins: fastestmirror
....
  logstash.noarch 1:6.6.0-1
Complete!
修改配置文件
[root@localhost ELK]# cd /etc/logstash/conf.d/
[root@localhost conf.d]# vim messages.conf

input {
        file {
                path => "/var/log/messages"
                type => "messages-log"
                start_position => "beginning"
        }
}

output {
        elasticsearch {
                hosts => "10.0.0.32:9200"
                index => "messages_log-%{+YYYY.MM.dd}"
        }
}
保存退出,启动服务
[root@localhost conf.d]# systemctl start logstash.service
通过查看日志需要授权 给目录
[root@localhost conf.d]# tail -f /var/log/logstash/logstash-plain.log
[2020-02-12T17:57:57,546][WARN ][filewatch.tailmode.handlers.createinitial] failed to open /var/log/messages: #<Errno::EACCES: Permission denied - /var/log/messages>, ["org/jruby/RubyFile.java:366:in `initialize'", "org/jruby/RubyIO.java:1154:in `open'", "/usr/share/logstash/vendor/bundle/jruby/2.3.0/gems/logstash-input-file-4.1.9/lib/filewatch/watched_file.rb:198:in `open'"]
授权并重新启动
chmod 755 -R /var/log/*
systemctl restart logstash.service
看端口有没有起来
[root@localhost ELK]# ss -lntp|grep 9600
LISTEN     0      50        ::ffff:127.0.0.1:9600                    :::*                   users:(("java",pid=3489,fd=86))
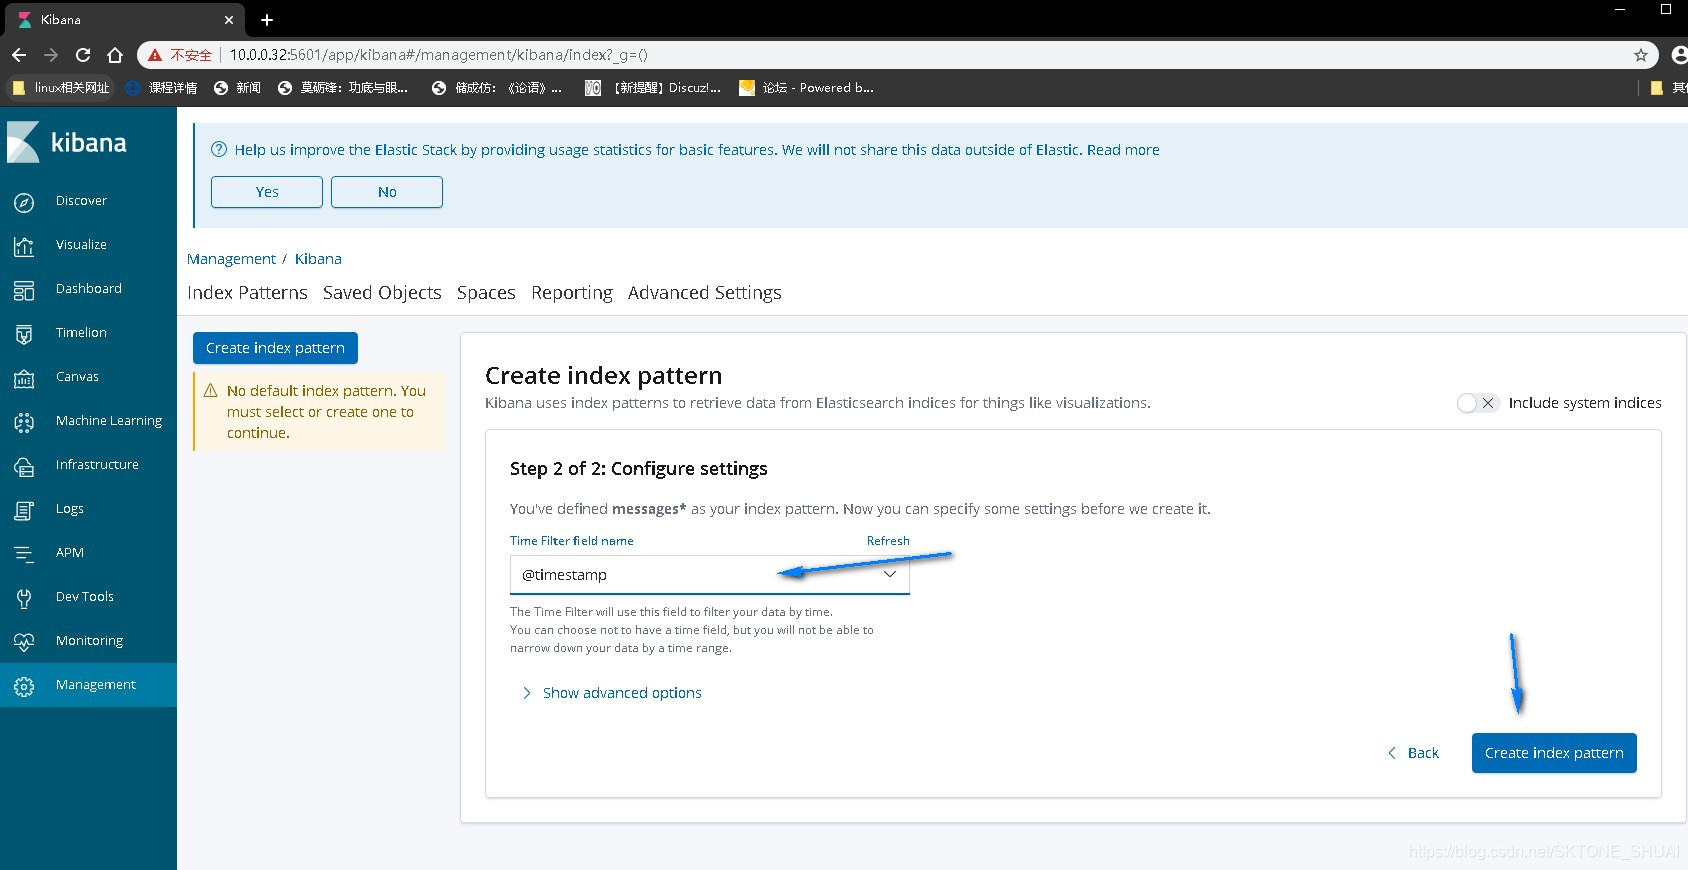
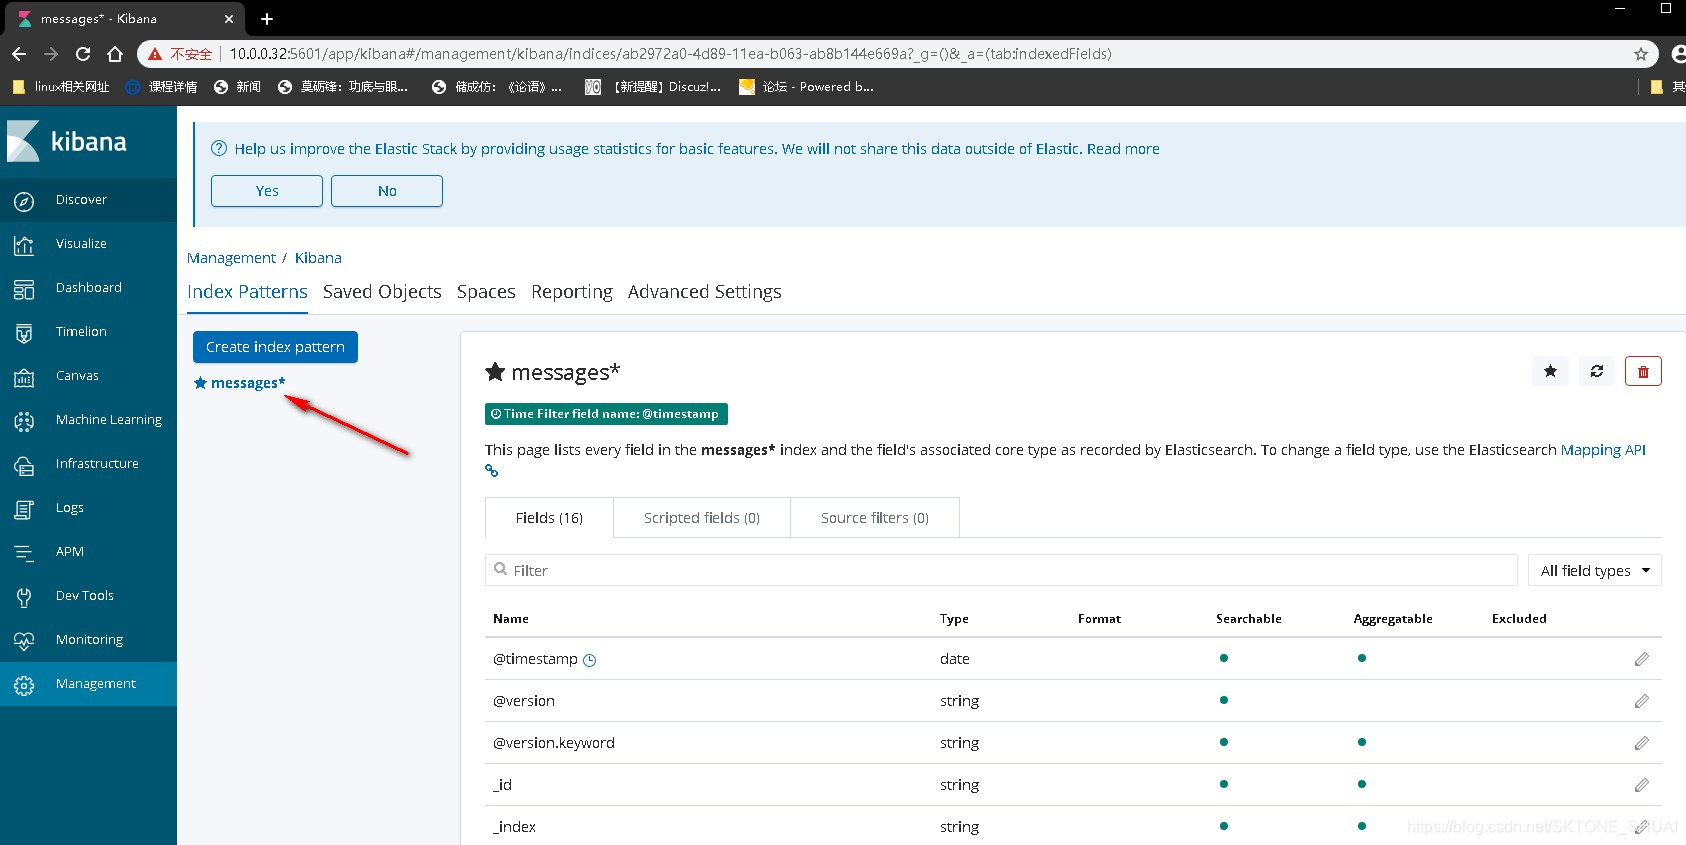
五、 IP(10.0.0.32:5601) 网址访问,添加索引
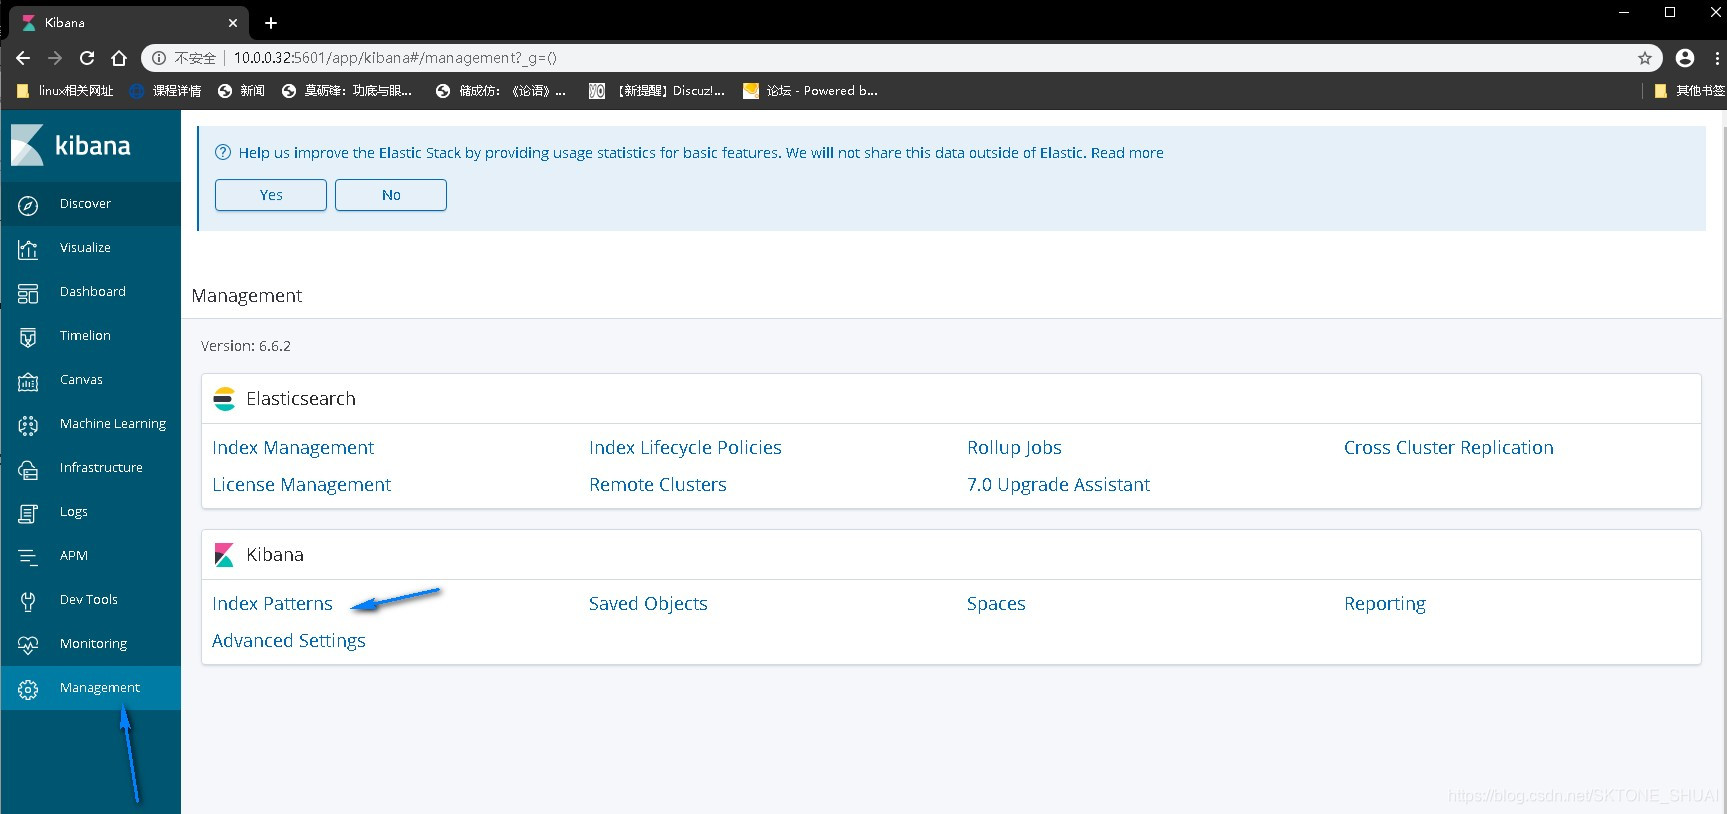

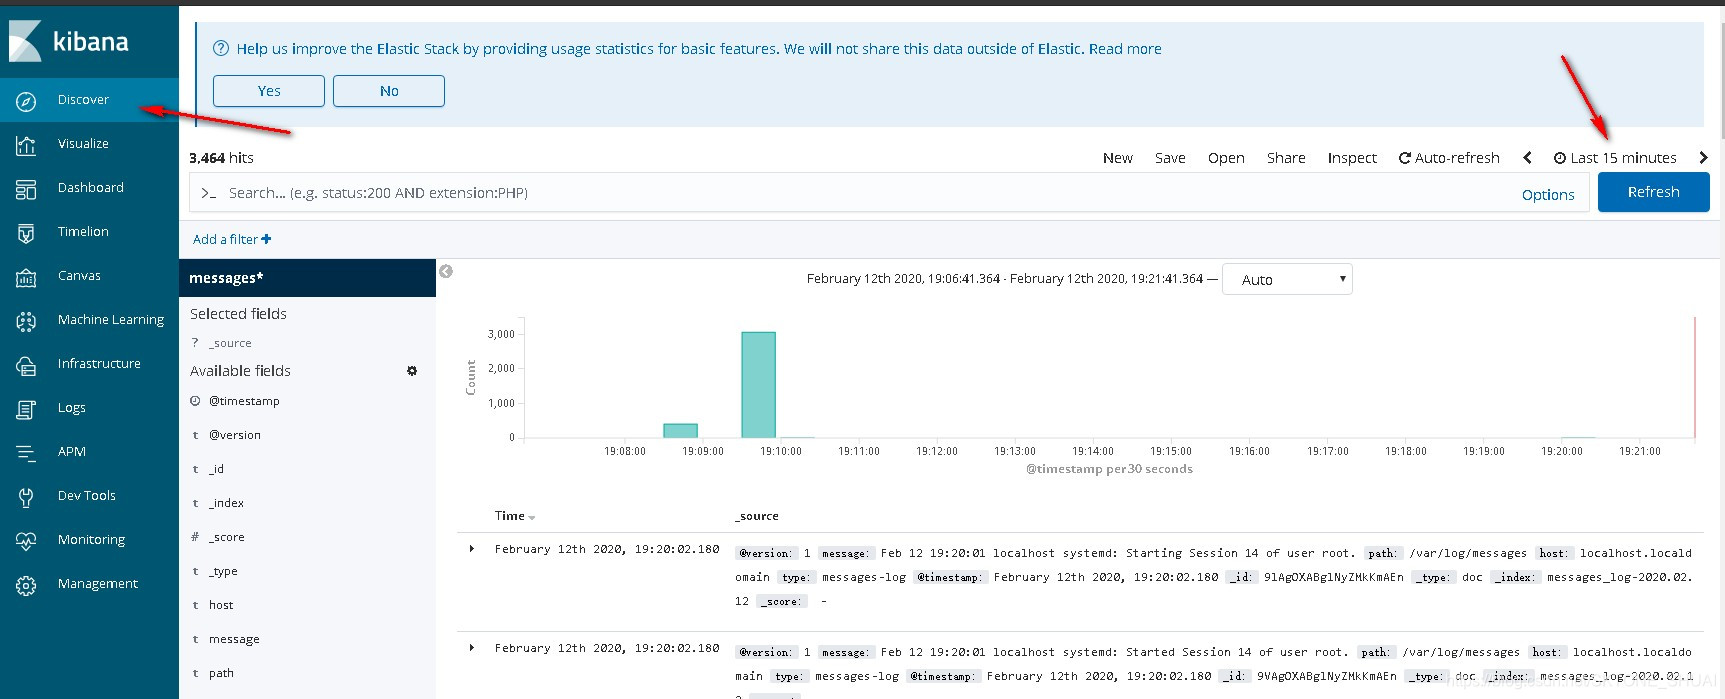
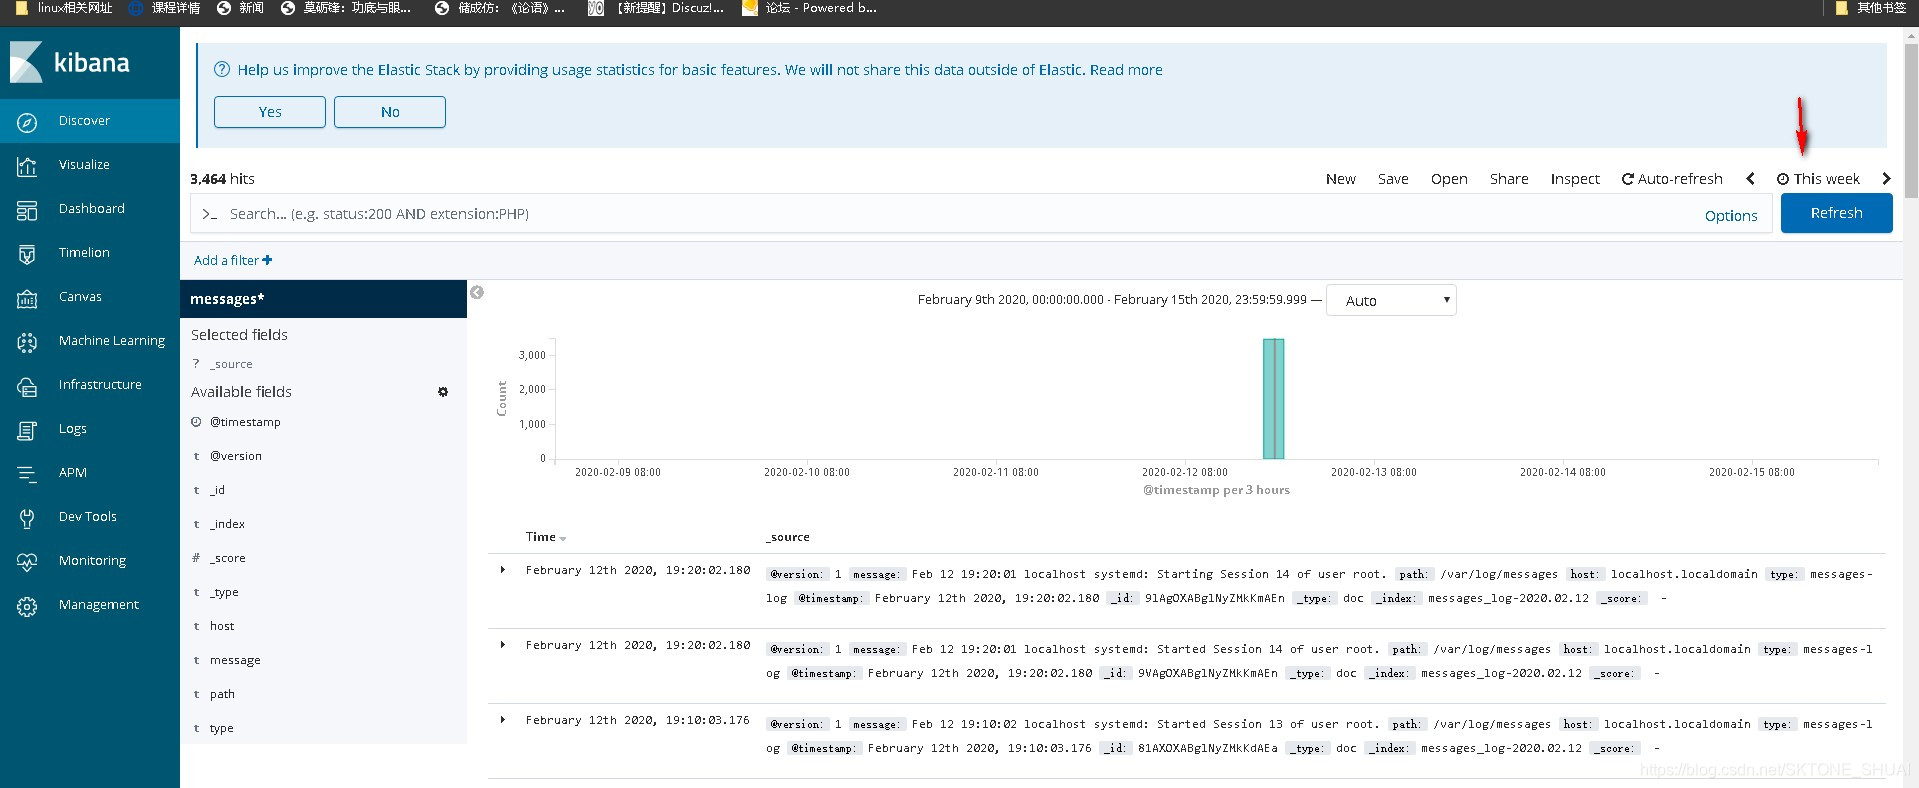
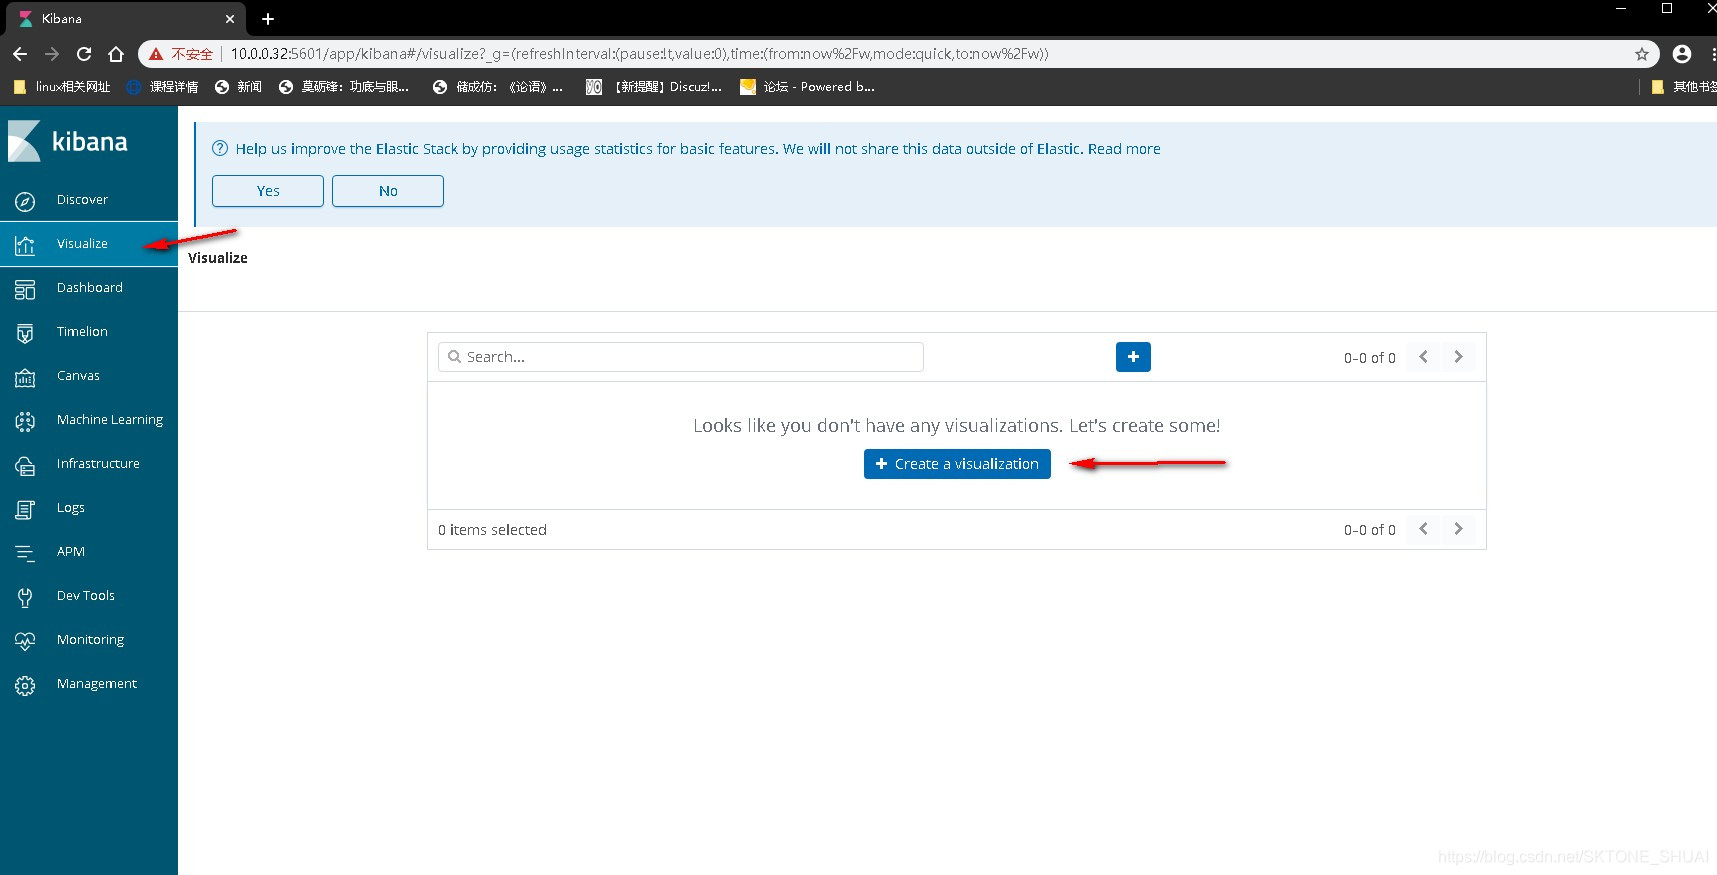
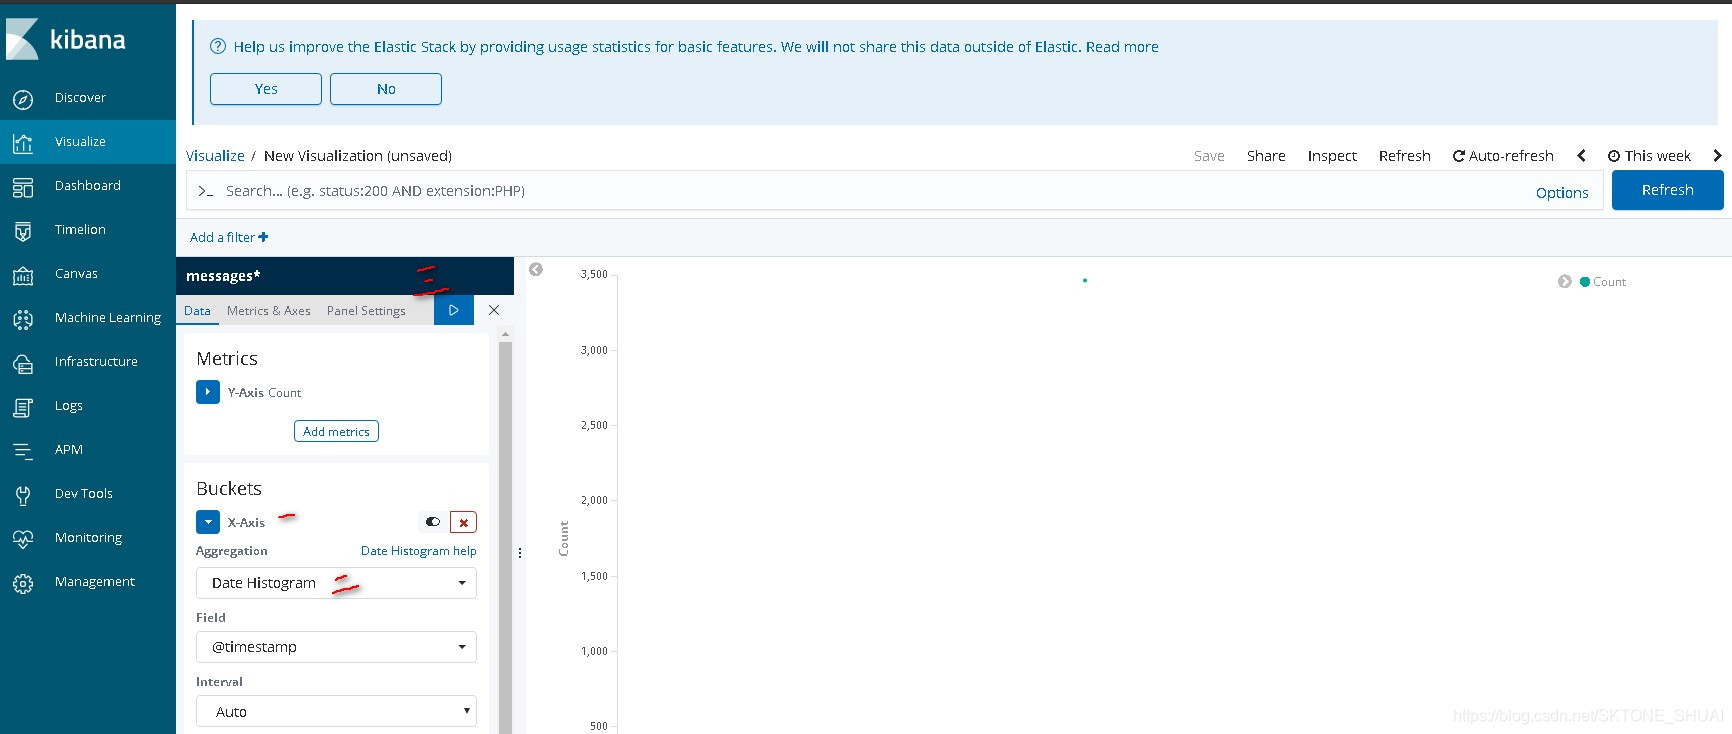
给日志添加可视化图形
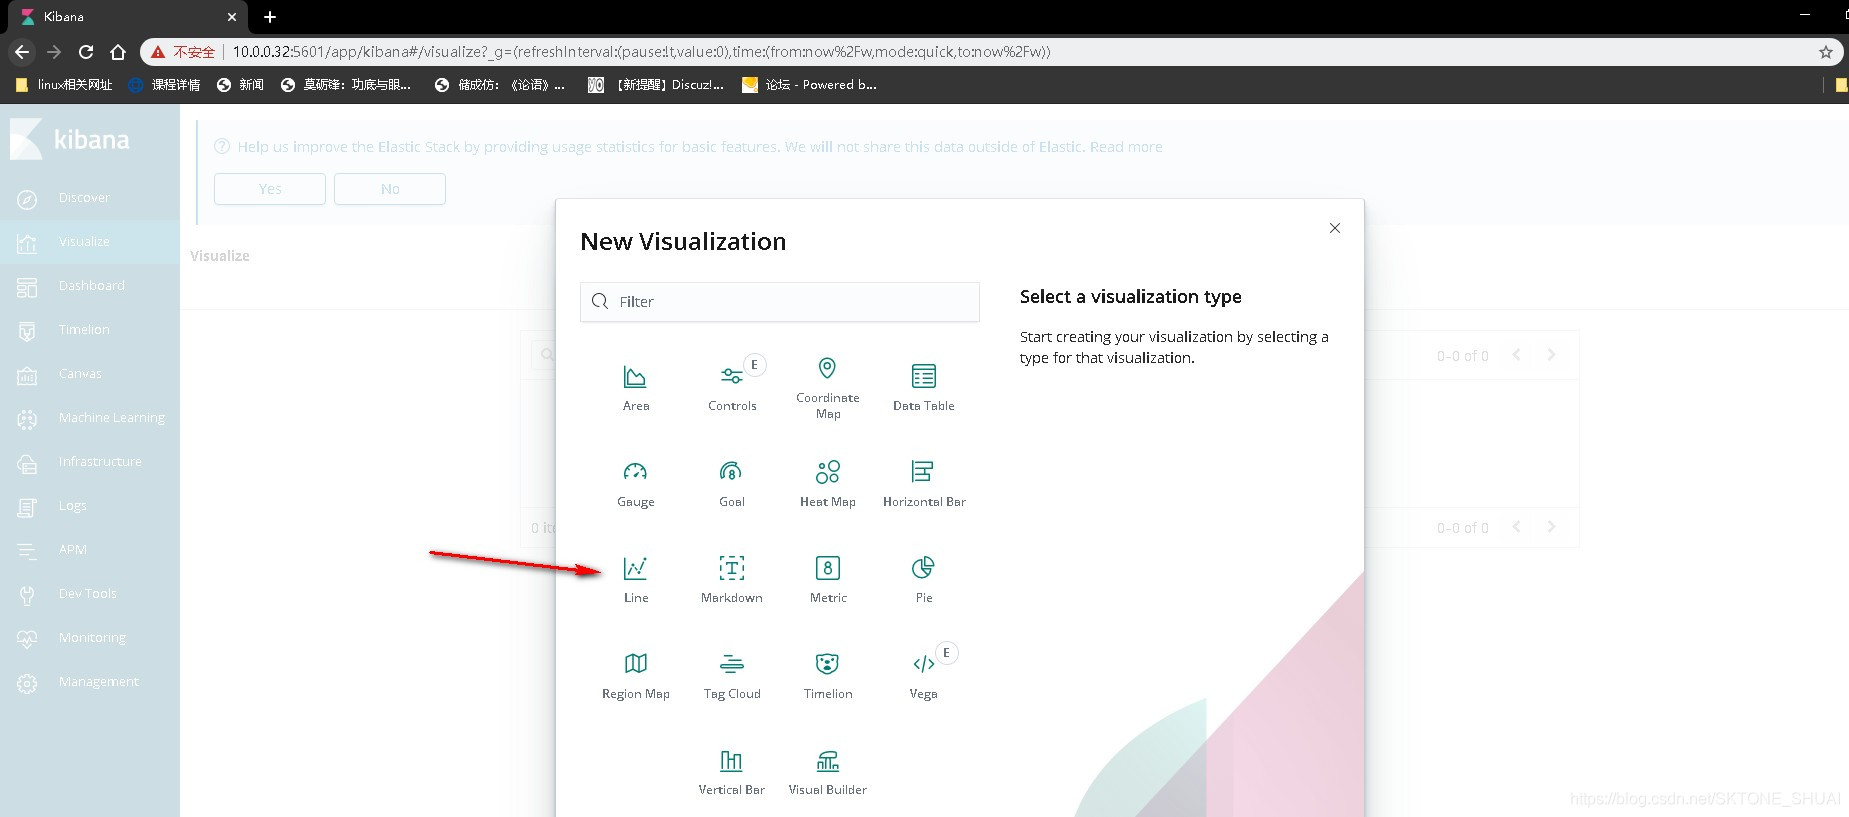
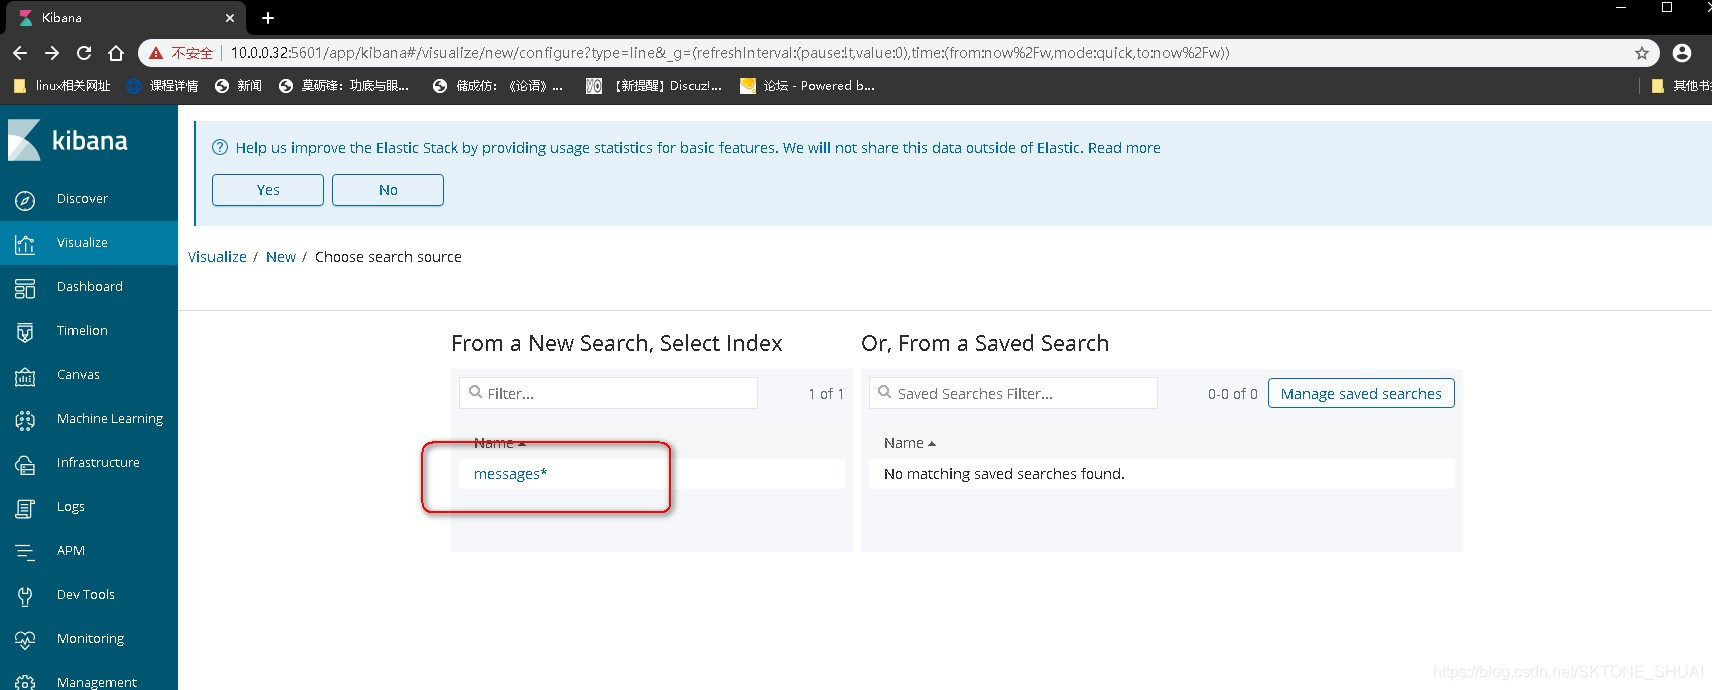
选择 x 轴为绘画日期的柱状图,然后点击开始获取数据
以上就是ELK的安装过程 安装过程服务可能起来会有些慢,耐心等待多试几次。
