开发日志——(5)
今天打算将图标的功能实现,将打开图表的选项放在右上方,所以重写MainActivity中的onOptionsItemSelected方法。增添Chart选项
   public boolean onOptionsItemSelected(MenuItem item) {


        int id = item.getItemId();
        if (id == R.id.action_chart) {
            Intent intent =new Intent(MainActivity.this,ChartsActivity.class);
            intent.putExtra("cost_list",(Serializable) mCostBeanList);
            startActivity(intent);
            return true;
        }
        else if (id == R.id.delete_all) {
            mDatabaseHelper.deleteAlldata();
            mCostBeanList.clear();
            mAdapter.notifyDataSetChanged();
            return true;
        }
        return super.onOptionsItemSelected(item);

    }
然后创建ChartsActivity。
package com.example.firstapplication;

import android.app.Activity;
import android.graphics.Color;
import android.os.Bundle;

import java.util.ArrayList;
import java.util.List;
import java.util.Map;
import java.util.TreeMap;

import lecho.lib.hellocharts.model.Axis;
import lecho.lib.hellocharts.model.ChartData;
import lecho.lib.hellocharts.model.Line;
import lecho.lib.hellocharts.model.LineChartData;
import lecho.lib.hellocharts.model.PointValue;
import lecho.lib.hellocharts.model.ValueShape;
import lecho.lib.hellocharts.util.ChartUtils;
import lecho.lib.hellocharts.view.Chart;
import lecho.lib.hellocharts.view.LineChartView;

public class ChartsActivity extends Activity {
    private LineChartView mChart;
    private Map<String,Integer> table = new TreeMap<>();
    private LineChartData mData;


    @Override
    protected void onCreate(Bundle savedInstanceState) {
        super.onCreate(savedInstanceState);
        setContentView(R.layout.chart_view);
        mChart = (LineChartView) findViewById(R.id.chart);
        List<CostBean> allDate = (List<CostBean>) getIntent().getSerializableExtra("cost_list");
        generateValuses(allDate);
        generateDate();
    }

    private void generateDate() {
        List<Line> lines = new ArrayList<>();
        List<PointValue> values = new ArrayList<>();
        int indexX = 0;
        for(Integer value : table.values()){
            values.add(new PointValue(indexX,value));
            indexX++;
        }
        Line line = new Line(values);
        line.setColor(ChartUtils.COLOR_BLUE);
        line.setShape(ValueShape.CIRCLE);
        line.setPointColor(ChartUtils.COLOR_RED);
        lines.add(line);
        mData = new LineChartData();
        mData .setLines(lines);
        mChart.setLineChartData(mData);
    }

    private void generateValuses(List<CostBean> allDate) {
        if(allDate!=null){
            for(int i = 0;i < allDate.size(); i++){
                CostBean costBean = allDate.get(i);
                String costDate = costBean.costDate;
                int costMoney = Integer.parseInt(costBean.costMoney);
                if(!table.containsKey(costDate)){
                    table.put(costDate,costMoney);

                } else {
                    int originMoney = table.get(costDate);
                    table.put(costDate,originMoney + costMoney);
                }
            }
        }
    }
}
在模拟器上验证时一直出bug,点击图表选项后app就会退出。后来才发现是少写了mChart.setLineChartData(mData);这句代码。
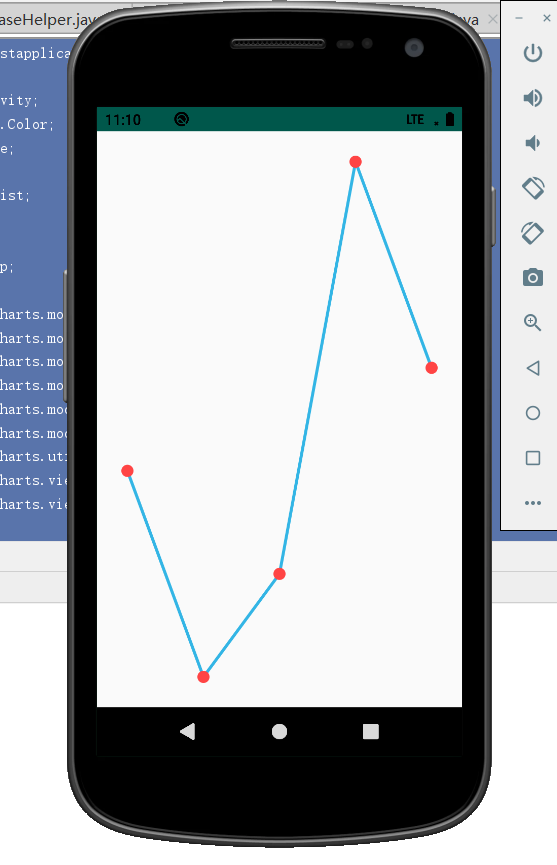
再模拟器上验证后的效果图:
明天尝试将app打包签名,在真机上试运行