使用的插件是FlareClusterLayer(插件链接)
插件案例,(部分代码,完整的请自行下载)
注意: 引入插件需要使用绝对地址
 <script> // 引入插件注意不能写 <script type="text/javascript">
        var dojoConfig = {
            async: true,
            tlmSiblingOfDojo: false,
            packages: [{
                name: "fcl",
                location: location.pathname.replace(/\/[^/]+$/, '') + "/fcl"
            }],
            has: {
                "esri-promise-compatibility": 1 // enable native promises and remove the warning about using when() instead of then(). https://developers.arcgis.com/javascript/latest/guide/release-notes/index.html#improved-compatibility-with-javascript-promises
            }
        };
</script>
主要代码
function initLayer(data) {

	// 默认样式
	var defaultSym = {
		type: "simple-marker",
		size: 6,
		color: "#FF0000",
		outline: null
	};

	var renderer = new ClassBreaksRenderer({
		defaultSymbol: defaultSym
	});
	renderer.field = "clusterCount";

	var smSymbol = {
		type: "simple-marker",
		color: [255, 204, 102, 0.8],
		size: 22,
		outline: {
			color: [221, 159, 34, 0.8]
		}
	}
	var mdSymbol = {
		type: "simple-marker",
		size: 24,
		outline: {
			color: [82, 163, 204, 0.8]
		},
		color: [102, 204, 255, 0.8]
	};
	var lgSymbol = {
		type: "simple-marker",
		size: 28,
		outline: {
			color: [41, 163, 41, 0.8]
		},
		color: [51, 204, 51, 0.8]
	};
	var xlSymbol = {
		type: "simple-marker",
		size: 32,
		outline: {
			color: [200, 52, 59, 0.8]
		},
		color: [250, 65, 74, 0.8]
	};

	renderer.addClassBreakInfo(0, 190, smSymbol);
	renderer.addClassBreakInfo(200, 1500, mdSymbol);
	renderer.addClassBreakInfo(1510, 5000, lgSymbol);
	renderer.addClassBreakInfo(5001, Infinity, xlSymbol);

	var areaRenderer;


	var options = {
		id: "flare-cluster-layer",
		clusterRenderer: renderer,
		spatialReference: new SpatialReference({
			"wkid": 4326
		}),
		subTypeFlareProperty: "deviceName",
		singleFlareTooltipProperty: "deviceId",
		displaySubTypeFlares: true,
		maxSingleFlareCount: 8,
		clusterRatio: 75,
		data: data
	}

	var clusterLayer = new fcl.FlareClusterLayer(options);
	map.add(clusterLayer);
}
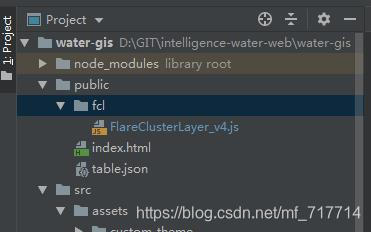
vue下使用
效果
首先在public/index.html引入插件
var dojoConfig = {
  async: true,
  tlmSiblingOfDojo: false,
  packages: [{
    name: "fcl",
    location: '<%= BASE_URL %>fcl/'// 绝对地址引入
  }],
  has: {
    "esri-promise-compatibility": 1 // enable native promises and remove the warning about using when() instead of then(). https://developers.arcgis.com/javascript/latest/guide/release-notes/index.html#improved-compatibility-with-javascript-promises
  }
};
主要的代码,通过控制clusterRatio 范围大小, 来控制点聚合区域, data为点集合数据
export default {
        name: "map-device-management",
        data() {
            return {
                vueArcGisApi: {
                    SimpleMarkerSymbol: null,
                    SimpleLineSymbol: null,
                    ClassBreaksRenderer: null,
                    PopupTemplate: null,
                    SpatialReference: null,
                    fcl: null
                },
                newArcGisModules: {
                    map: null,
                    mapView: null
                },
                nodesData: []
            }
        },
        computed: mapGetters(['getMapURL', 'getMapPipeURL', 'getMapView', 'getMapZoomLods',  'getCurrDeviceInfo']),
        watch: {
            getCurrDeviceInfo: {
                handler() {
                    this.getGraphicsPointDataInit()
                },
                deep: true
            }
        },
        created() {
            this.getGraphicsPointDataInit()
        },
        methods: {
            getGraphicsPointDataInit() {
                getDeviceInfo(this.getCurrDeviceInfo).then(res => {
                    if (res.status == 200 && res.data.success) {
                        res.data.data.forEach(curr => {
                            const {x, y} = curr
                            curr.x = Number(x)
                            curr.y = Number(y)
                        })

                        this.nodesData = res.data.data
                        this.$nextTick(() => {
                            this.loadedArcGisModules()
                        })
                    }
                })
            },
            initLayer(data) {
                const defaultSym = new this.vueArcGisApi.SimpleMarkerSymbol({
                    size: 6,
                    color: "#FF0000",
                    outline: null
                });

                const renderer = new this.vueArcGisApi.ClassBreaksRenderer({
                    defaultSymbol: defaultSym
                });
                renderer.field = "clusterCount";

                const smSymbol = new this.vueArcGisApi.SimpleMarkerSymbol({ size: 22, outline: new this.vueArcGisApi.SimpleLineSymbol({ color: [221, 159, 34, 0.8] }), color: [255, 204, 102, 0.8] });
                const mdSymbol = new this.vueArcGisApi.SimpleMarkerSymbol({ size: 24, outline: new this.vueArcGisApi.SimpleLineSymbol({ color: [82, 163, 204, 0.8] }), color: [102, 204, 255, 0.8] });
                const lgSymbol = new this.vueArcGisApi.SimpleMarkerSymbol({ size: 28, outline: new this.vueArcGisApi.SimpleLineSymbol({ color: [41, 163, 41, 0.8] }), color: [51, 204, 51, 0.8] });
                const xlSymbol = new this.vueArcGisApi.SimpleMarkerSymbol({ size: 32, outline: new this.vueArcGisApi.SimpleLineSymbol({ color: [200, 52, 59, 0.8] }), color: [250, 65, 74, 0.8] });

                renderer.addClassBreakInfo(0, 19, smSymbol);
                renderer.addClassBreakInfo(20, 150, mdSymbol);
                renderer.addClassBreakInfo(151, 1000, lgSymbol);
                renderer.addClassBreakInfo(1001, Infinity, xlSymbol);

                let areaRenderer;

                // if area display mode is set. Create a renderer to display cluster areas. Use SimpleFillSymbols as the areas are polygons
                const defaultAreaSym = new this.vueArcGisApi.SimpleFillSymbol({
                    style: "solid",
                    color: [0, 0, 0, 0.2],
                    outline: new this.vueArcGisApi.SimpleLineSymbol({ color: [0, 0, 0, 0.3] })
                });

                areaRenderer = new this.vueArcGisApi.ClassBreaksRenderer({
                    defaultSymbol: defaultAreaSym
                });
                areaRenderer.field = "clusterCount";

                const smAreaSymbol = new this.vueArcGisApi.SimpleFillSymbol({ color: [255, 204, 102, 0.4], outline: new this.vueArcGisApi.SimpleLineSymbol({ color: [221, 159, 34, 0.8], style: "dash" }) });
                const mdAreaSymbol = new this.vueArcGisApi.SimpleFillSymbol({ color: [102, 204, 255, 0.4], outline: new this.vueArcGisApi.SimpleLineSymbol({ color: [82, 163, 204, 0.8], style: "dash" }) });
                const lgAreaSymbol = new this.vueArcGisApi.SimpleFillSymbol({ color: [51, 204, 51, 0.4], outline: new this.vueArcGisApi.SimpleLineSymbol({ color: [41, 163, 41, 0.8], style: "dash" }) });
                const xlAreaSymbol = new this.vueArcGisApi.SimpleFillSymbol({ color: [250, 65, 74, 0.4], outline: new this.vueArcGisApi.SimpleLineSymbol({ color: [200, 52, 59, 0.8], style: "dash" }) });

                areaRenderer.addClassBreakInfo(0, 19, smAreaSymbol);
                areaRenderer.addClassBreakInfo(20, 150, mdAreaSymbol);
                areaRenderer.addClassBreakInfo(151, 1000, lgAreaSymbol);
                areaRenderer.addClassBreakInfo(1001, Infinity, xlAreaSymbol);

                // Set up another class breaks renderer to style the flares individually
                const flareRenderer = new this.vueArcGisApi.ClassBreaksRenderer({
                    defaultSymbol: renderer.defaultSymbol
                });
                flareRenderer.field = "clusterCount";

                const smFlareSymbol = new this.vueArcGisApi.SimpleMarkerSymbol({ size: 14, color: [255, 204, 102, 0.8], outline: new this.vueArcGisApi.SimpleLineSymbol({ color: [221, 159, 34, 0.8] }) });
                const mdFlareSymbol = new this.vueArcGisApi.SimpleMarkerSymbol({ size: 14, color: [102, 204, 255, 0.8], outline: new this.vueArcGisApi.SimpleLineSymbol({ color: [82, 163, 204, 0.8] }) });
                const lgFlareSymbol = new this.vueArcGisApi.SimpleMarkerSymbol({ size: 14, color: [51, 204, 51, 0.8], outline: new this.vueArcGisApi.SimpleLineSymbol({ color: [41, 163, 41, 0.8] }) });
                const xlFlareSymbol = new this.vueArcGisApi.SimpleMarkerSymbol({ size: 14, color: [250, 65, 74, 0.8], outline: new this.vueArcGisApi.SimpleLineSymbol({ color: [200, 52, 59, 0.8] }) });

                flareRenderer.addClassBreakInfo(0, 19, smFlareSymbol);
                flareRenderer.addClassBreakInfo(20, 150, mdFlareSymbol);
                flareRenderer.addClassBreakInfo(151, 1000, lgFlareSymbol);
                flareRenderer.addClassBreakInfo(1001, Infinity, xlFlareSymbol);


                const popupTemplate = new this.vueArcGisApi.PopupTemplate({
                    title: "{deviceName}",
                    content: [{
                        type: "fields",
                        fieldInfos: [
                            { fieldName: "deviceName", label: "deviceName", visible: true },
                            { fieldName: "deviceId", label: "deviceId", visible: true },
                        ]
                    }]
                });

                const options = {
                    id: "flare-cluster-layer",
                    clusterRenderer: renderer,
                    areaRenderer: areaRenderer,
                    flareRenderer: flareRenderer,
                    singlePopupTemplate: popupTemplate,
                    spatialReference: new this.vueArcGisApi.SpatialReference({ "wkid": 4326 }),
                    subTypeFlareProperty: "deviceName",
                    singleFlareTooltipProperty: "deviceId",
                    displaySubTypeFlares: true,
                    maxSingleFlareCount: 10,
                    clusterRatio: 200,
                    clusterAreaDisplay: 'activated',
                    data: data
                }

                let clusterLayer = new this.vueArcGisApi.fcl.FlareClusterLayer(options);
                this.newArcGisModules.map.add(clusterLayer);

            },
            loadedArcGisModules() {
                loadModules([
                    "esri/Map",
                    "esri/views/MapView",
                    "esri/layers/MapImageLayer",
                    "esri/PopupTemplate",
                    "esri/symbols/SimpleMarkerSymbol",
                    "esri/symbols/SimpleLineSymbol",
                    "esri/symbols/SimpleFillSymbol",
                    "esri/renderers/ClassBreaksRenderer",
                    "esri/geometry/SpatialReference",
                    "fcl/FlareClusterLayer_v4",
                ])
                    .then(([Map, MapView, MapImageLayer, PopupTemplate, SimpleMarkerSymbol,
                               SimpleLineSymbol, SimpleFillSymbol, ClassBreaksRenderer, SpatialReference, fcl
                           ]) => {
                        this.vueArcGisApi = {
                            PopupTemplate, SimpleMarkerSymbol,SimpleLineSymbol, SimpleFillSymbol, ClassBreaksRenderer, SpatialReference, fcl
                        }
                        const mapLayer = new MapImageLayer({url: this.getMapURL}) // 底图地图
                        const pipeLayer = new MapImageLayer({url: this.getMapPipeURL}) // 管线底图

                        const map = new Map({
                            layers: [mapLayer, pipeLayer]
                        });

                        const mapView = new MapView({
                            map: map,
                            container: "mapDeviceManagement",
                            center: this.getMapView.center,
                            zoom: 6,
                            constraints: {
                                minZoom: 0,
                                lods: this.getMapZoomLods
                            }
                        });
                        mapView.ui._removeComponents(["attribution"]); //去掉logo
                        mapView.ui.move(["zoom"], "bottom-right"); // 缩放控件移动到右下方

                        this.newArcGisModules = {
                            map, mapView
                        }

                        mapView.when( () => {
                            this.initLayer(this.nodesData);
                        });


                    })
                    .catch(err => {
                        // handle any errors
                        console.error(err);
                    });
            }
        },
        mounted() {

        }
    }
vue-arcgis点聚合案例下载地址: //download.csdn.net/download/mf_717714/11997966
