本章首先探索在线公开数据源。然后介绍CSV和JSON格式数据的处理,并分别用Matplotlib和Plotly做可视化。
CSV文件格式
CSV(comma-separated values)格式,正如其名字所示,就是用逗号分割的值。
CSV非常适合于快速处理。
在随书示例中已包含示例数据,这些数据来自于Climate Data Online
以下程序读取CSV文件中的最高气温:
import csv

filename = 'data/sitka_weather_2018_simple.csv'
with open(filename) as f:
    reader = csv.reader(f)
    header_row = next(reader)

    # Get dates and high temperatures from this file.
    dates, highs = [], []
    for row in reader:
        high = int(row[5])
        highs.append(high)

print(highs)
年度日最高气温绘图如下:
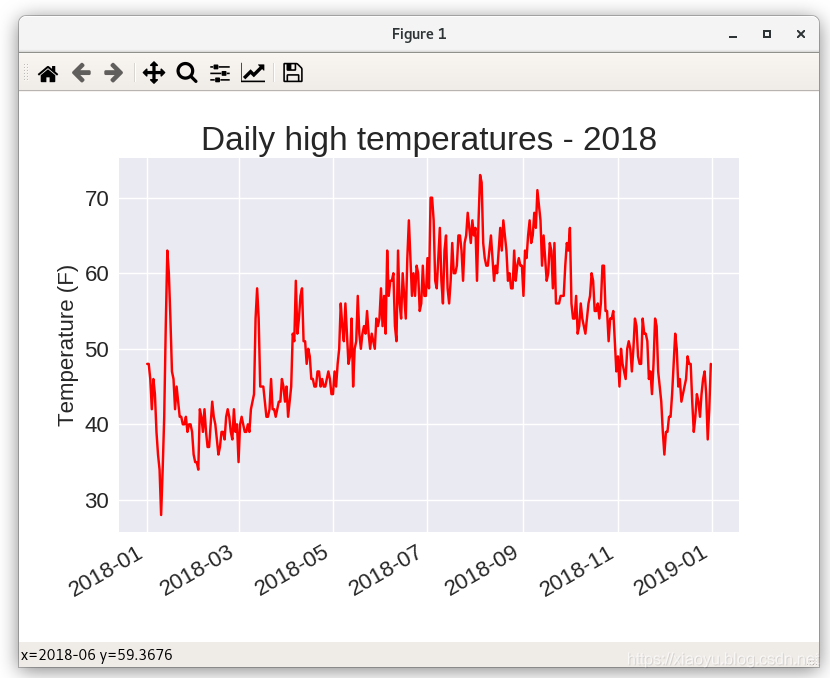
需要指出,数据在CSV中已经按日期排序。
然后加上每日最低温,我们看一下代码片段:
...
fig, ax = plt.subplots()
ax.plot(dates, highs, c='red', alpha=0.5) # 日最高温
ax.plot(dates, lows, c='blue', alpha=0.5) # 日最低温
...
fig.autofmt_xdate()	# 第一次使用fig变量
...
输出如下:

在两个曲线中间可以选择填充或不填充。
接下来讲的是错误处理,也就是有些值为空的情况,通过exception可以处理。
我们也可以自己下载气候数据。

映射全局数据集:JSON格式
本节将用Plotly来展示JSON格式的地震数据。数据来自United States Geological Survey。

一些地震术语:
- magnitude: 震级
- Richter scale:里氏震级,下载示例数据只包含M1级及以上数据
- longitude:经度
- latitude:纬度
以下是一条地震数据:
        {
            "type": "Feature",
            "properties": {
                "mag": 1.2,
                "place": "11km NNE of North Nenana, Alaska",
                "time": 1550358909272,
                "updated": 1550359211283,
                "tz": -540,
                "url": "https://earthquake.usgs.gov/earthquakes/eventpage/ak0192641ikq",
                "detail": "https://earthquake.usgs.gov/earthquakes/feed/v1.0/detail/ak0192641ikq.geojson",
                "felt": null,
                "cdi": null,
                "mmi": null,
                "alert": null,
                "status": "automatic",
                "tsunami": 0,
                "sig": 22,
                "net": "ak",
                "code": "0192641ikq",
                "ids": ",ak0192641ikq,",
                "sources": ",ak,",
                "types": ",geoserve,origin,",
                "nst": null,
                "dmin": null,
                "rms": 0.94,
                "gap": null,
                "magType": "ml",
                "type": "earthquake",
                "title": "M 1.2 - 11km NNE of North Nenana, Alaska"
            },
            "geometry": {
                "type": "Point",
                "coordinates": [
                    -148.9865,
                    64.6673,
                    0
                ]
            },
            "id": "ak0192641ikq"
        },
以下代码读取所有地震数据,features在整个文件中只出现了一次:
all_eq_dicts = all_eq_data['features']
print(len(all_eq_dicts))
读取单条地震数据的震级:
mags = []
   for eq_dict in all_eq_dicts:
   	   mag = eq_dict['properties']['mag']
       mags.append(mag)
接下来读取地震发生的位置:
lon = eq_dict['geometry']['coordinates'][0]
lat = eq_dict['geometry']['coordinates'][1]
以下是完整的探索数据的代码eq_explore_data.py:
import json

# Explore the structure of the data.
filename = 'data/eq_data_1_day_m1.json'
with open(filename) as f:
    all_eq_data = json.load(f)

all_eq_dicts = all_eq_data['features']

mags, lons, lats = [], [], []
for eq_dict in all_eq_dicts:
    mag = eq_dict['properties']['mag']
    lon = eq_dict['geometry']['coordinates'][0]
    lat = eq_dict['geometry']['coordinates'][1]
    mags.append(mag)
    lons.append(lon)
    lats.append(lat)

print(mags[:10])
print(lons[:5])
print(lats[:5])
JSON的处理是很强大的,使用也很简单,只需搞清楚JSON的结构。
接下来做可视化。会做一些定制,如:
- 根据震级显示点的大小
- 根据震级显示颜色深浅
以下代码显示可用的色阶(color scale):
>>> from plotly import colors
>>> for key in colors.PLOTLY_SCALES.keys():
...     print(key)
...
Greys
YlGnBu
Greens
YlOrRd
Bluered
RdBu
Reds
Blues
Picnic
Rainbow
Portland
Jet
Hot
Blackbody
Earth
Electric
Viridis
Cividis
以下为程序输出,悬浮文本也是通过代码拼接出来的:

Plotly运行程序有警告:
This tool has been deprecated, use 'gio open' instead.
