1. 概述
1.1 总体目标
从监控平台本身的业务需求分析来看,我们至少应该希望通过Prometheus平台获取到以下监控数据:
性能指标
1.容器相关的性能指标数据(如:cpu, memory, filesystem)
2.Pod相关的性能指标数据
3.主机节点相关的性能指标数据服务健康状态
1.Deployment相关的健康状态(health or unhealth)
2.Pod的健康状态
3.主机Node节点的健康状态
除了获取监控数据意外,我们还需要对一些特定的异常情况进行告警,因此需要配合使用AlertManager使用告警通知。
1.2 主流监控方案
目前对于kubernetes的主流监控方案主要有以下两种:
- heapster+influxDB
heapster为k8s而生,它从apiserver获取节点信息,每个节点的kubelet内含cAdvisor,暴露出api,heapster通过访问这些端点得到容器监控数据。它支持多种储存方式,常用的的是influxDB。这套方案的缺点是缺乏报警等功能以及influxDB的单点问题。 - prometheus
本方案下文详细叙述。
2. 实现思路和要点
2.1 容器和Pod相关的性能指标数据—cadvisor
cAdvisor是谷歌开源的一个容器监控工具,目前cAdvisor集成到了kubelet组件内,可以在kube集群中每个启动了kubelet的节点使用cAdvisor来查看该节点的运行数据。因此可以直接用过cAdvisor提供的metrics接口获取到所有容器相关的性能指标数据。
该工具提供了webUI和REST API两种方式来展示数据,从而可以帮助管理者了解主机以及容器的资源使用情况和性能数据。cAdvisor对外提供web服务的默认端口为4194(http://nodeIP:4194,prometheus格式数据提供接口:nodeIP:4194/metrics),rest API服务端口默认为10255(http://nodeIP:10255/stats(/summary)).
prometheus获取监控端点的方式有很多,其中就包括k8s,prometheu会通过调用master的apiserver获取到节点信息,然后去调取每个节点的数据。
prometheus作为一个时间序列数据收集,处理,存储的服务,能够监控的对象必须直接或间接提供prometheus认可的数据模型,通过http api的形式暴露出来。我们知道cAdvisor支持prometheus,同样,包含了cAdivisor的kubelet也支持prometheus。每个节点都暴露了供prometheus调用的api。
- 查看数据nodeIP:4194/metrics,可以看到是按prometheus的格式输出的数据:
# HELP cadvisor_version_info A metric with a constant '1' value labeled by kernel version, OS version, docker version, cadvisor version & cadvisor revision.
# TYPE cadvisor_version_info gauge
cadvisor_version_info{cadvisorRevision="",cadvisorVersion="",dockerVersion="1.12.3",kernelVersion="4.9.0-1.2.el7.bclinux.x86_64",osVersion="Debian GNU/Linux 8 (jessie)"} 1
# HELP container_cpu_cfs_periods_total Number of elapsed enforcement period intervals.
# TYPE container_cpu_cfs_periods_total counter
container_cpu_cfs_periods_total{container_name="",id="/kubepods/burstable/pod5aec9dff0e41760e3c9b421bc9d034fa",image="",name="",namespace="",pod_name=""} 3.0160829e+07
container_cpu_cfs_periods_total{container_name="",id="/kubepods/burstable/poda8a515dcc2d15d092f28266ae34e1d62",image="",name="",namespace="",pod_name=""} 4.016655e+06
container_cpu_cfs_periods_total{container_name="",id="/kubepods/burstable/podafbe65981008ac38e2634ceba6169a4e",image="",name="",namespace="",pod_name=""} 2.401024e+07
container_cpu_cfs_periods_total{container_name="",id="/kubepods/burstable/podef773c7b69c2891d314706653809c4c7",image="",name="",namespace="",pod_name=""} 8.793728e+06
container_cpu_cfs_periods_total{container_name="",id="/kubepods/pod5f9a1823-fb84-11e7-85c5-00505694b7e8",image="",name="",namespace="",pod_name=""} 47539
container_cpu_cfs_periods_total{container_name="kube-apiserver",id="/kubepods/burstable/pod5aec9dff0e41760e3c9b421bc9d034fa/36cb499de1f4fc407decc7264dc58b307cde1821ad3b0f02727761b27dbfda22",image="quay.io/coreos/hyperkube@sha256:489401d5cc14505c0baecedff7b16301e70322eb6c03157a5a40a95e8b376bac",name="k8s_kube-apiserver_kube-apiserver-k8smaster01_kube-system_5aec9dff0e41760e3c9b421bc9d034fa_0",namespace="kube-system",pod_name="kube-apiserver-k8smaster01"} 2.0525293e+07
container_cpu_cfs_periods_total{container_name="kube-controller-manager",id="/kubepods/burstable/poda8a515dcc2d15d092f28266ae34e1d62/4b8b29de375e8a2475e8c53d98b8da3bb7df7ea1f251321b814afc1e41e5074b",image="quay.io/coreos/hyperkube@sha256:489401d5cc14505c0baecedff7b16301e70322eb6c03157a5a40a95e8b376bac",name="k8s_kube-controller-manager_kube-controller-manager-k8smaster01_kube-system_a8a515dcc2d15d092f28266ae34e1d62_6",namespace="kube-system",pod_name="kube-controller-manager-k8smaster01"} 1.630663e+06
container_cpu_cfs_periods_total{container_name="kube-proxy",id="/kubepods/burstable/podef773c7b69c2891d314706653809c4c7/0628a30f38ba31446f4ed2db2b011c577158be780a36c312df6215ff3b31ee49",image="quay.io/coreos/hyperkube@sha256:489401d5cc14505c0baecedff7b16301e70322eb6c03157a5a40a95e8b376bac",name="k8s_kube-proxy_kube-proxy-k8smaster01_kube-system_ef773c7b69c2891d314706653809c4c7_4",namespace="kube-system",pod_name="kube-proxy-k8smaster01"} 8.793785e+06
container_cpu_cfs_periods_total{container_name="kube-scheduler",id="/kubepods/burstable/podafbe65981008ac38e2634ceba6169a4e/a04e8db7b213951d25850a3e947ace4d60a1d08e14afb074745977647b26b545",image="quay.io/coreos/hyperkube@sha256:489401d5cc14505c0baecedff7b16301e70322eb6c03157a5a40a95e8b376bac",name="k8s_kube-scheduler_kube-scheduler-k8smaster01_kube-system_afbe65981008ac38e2634ceba6169a4e_6",namespace="kube-system",pod_name="kube-scheduler-k8smaster01"} 2.1163397e+07
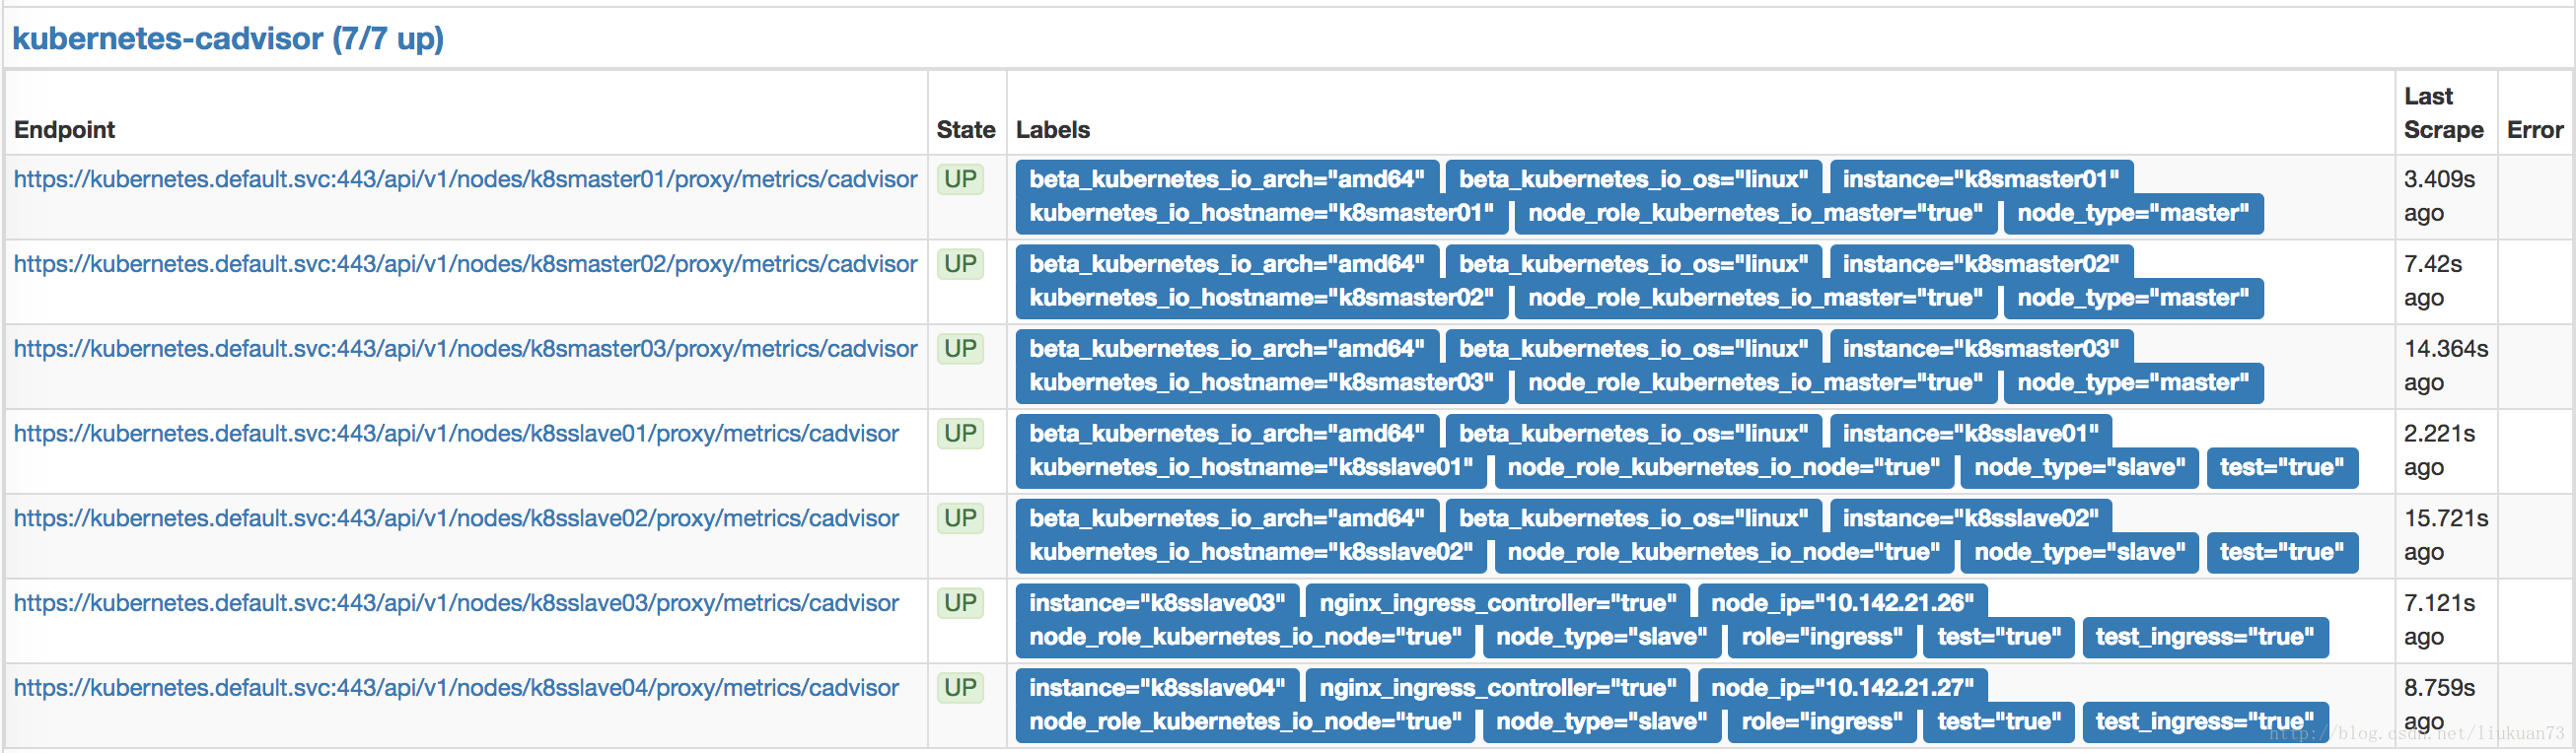
...在prometheus的target中可以看到采到的信息:
备注:在1.7.3以后版本中cadvisor的metrics被从kubelet metrics的endpoint中独立出来了,在prometheus采集的时候变成两个scrape的jobcadvisor 的接口:
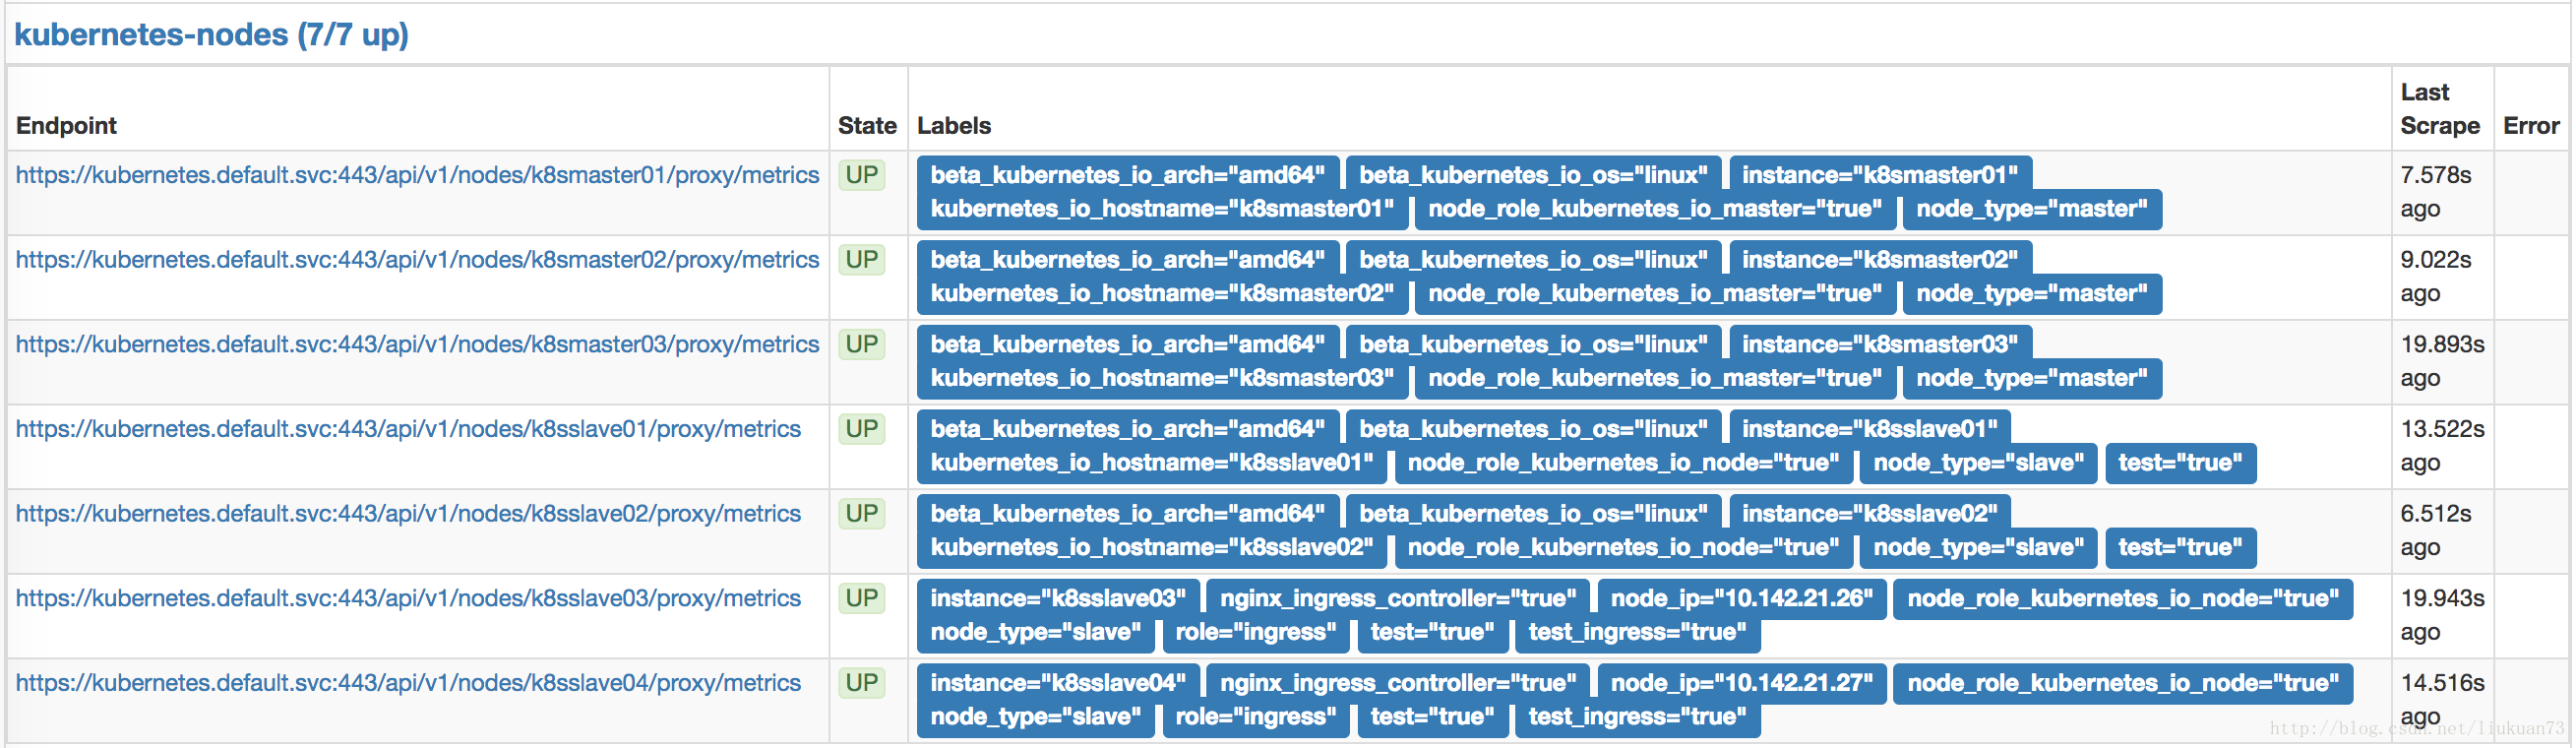
以上是cadvisor的metrics接口,在集群内部用kube-apiserver做proxy,如:https://kubernetes.default.svc:443/api/v1/nodes/k8smaster01/proxy/metrics/cadvisor,获取到的数据和直接访问nodeIP:4194/metrics获取到的一样。kubelet metrics接口:
以上是kubelet的metrics接口,在集群内部用kube-apiserver做proxy,如:https://kubernetes.default.svc:443/api/v1/nodes/k8smaster01/proxy/metrics
2.2 主机节点性能指标数据—node-exporter
Prometheus社区提供的NodeExporter项目可以对于主机的关键度量指标状态监控,通过kubernetes的Deamon Set我们可以确保在各个主机节点上部署单独的NodeExporter实例,从而实现对主机数据的监控
- 附我的node-exporter-daemonset.yaml文件(相关文件请见:https://github.com/liukuan73/k8s-monitor):
apiVersion: extensions/v1beta1
kind: DaemonSet
metadata:
  name: prometheus-node-exporter
  namespace: kube-system
  labels:
    app: prometheus-node-exporter
spec:
  template:
    metadata:
      name: prometheus-node-exporter
      labels:
        app: prometheus-node-exporter
    spec:
      containers:
      - image: prom/node-exporter:v0.15.0
        imagePullPolicy: IfNotPresent
        name: prometheus-node-exporter
        ports:
        - name: prom-node-exp
          #^ must be an IANA_SVC_NAME (at most 15 characters, ..)
          containerPort: 9100
          hostPort: 9100
      tolerations:
      - key: "master"
        operator: "Equal"
        value: "true"
        effect: "NoSchedule"
      hostNetwork: true
      hostPID: true
      restartPolicy: Always
---
apiVersion: v1
kind: Service
metadata:
  annotations:
    prometheus.io/scrape: 'true'
  name: prometheus-node-exporter
  namespace: kube-system
  labels:
    app: prometheus-node-exporter
spec:
  clusterIP: None
  ports:
    - name: prometheus-node-exporter
      port: 9100
      protocol: TCP
  selector:
    app: prometheus-node-exporter
  type: ClusterIP
备注:
1.在Service中定义标注prometheus.io/scrape: ‘true’,表明该Service需要被promethues发现并采集数据
2.Promethues可以在容器内通过DNS地址 https://kubernetes.default.svc 访问kubernetes的Rest API.
3.node-exporter使用hostNetwork模式查看数据:nodeIP:9100/metrics,可以看到是按prometheus的格式输出的数据:
# HELP go_gc_duration_seconds A summary of the GC invocation durations.
# TYPE go_gc_duration_seconds summary
go_gc_duration_seconds{quantile="0"} 3.4159e-05
go_gc_duration_seconds{quantile="0.25"} 4.5062e-05
go_gc_duration_seconds{quantile="0.5"} 5.6108e-05
go_gc_duration_seconds{quantile="0.75"} 7.5753e-05
go_gc_duration_seconds{quantile="1"} 0.000627203
go_gc_duration_seconds_sum 3.606392117
go_gc_duration_seconds_count 22665
# HELP go_goroutines Number of goroutines that currently exist.
# TYPE go_goroutines gauge
go_goroutines 14
# HELP go_info Information about the Go environment.
# TYPE go_info gauge
go_info{version="go1.9.1"} 1
# HELP go_memstats_alloc_bytes Number of bytes allocated and still in use.
# TYPE go_memstats_alloc_bytes gauge
go_memstats_alloc_bytes 1.291248e+06
# HELP go_memstats_alloc_bytes_total Total number of bytes allocated, even if freed.
# TYPE go_memstats_alloc_bytes_total counter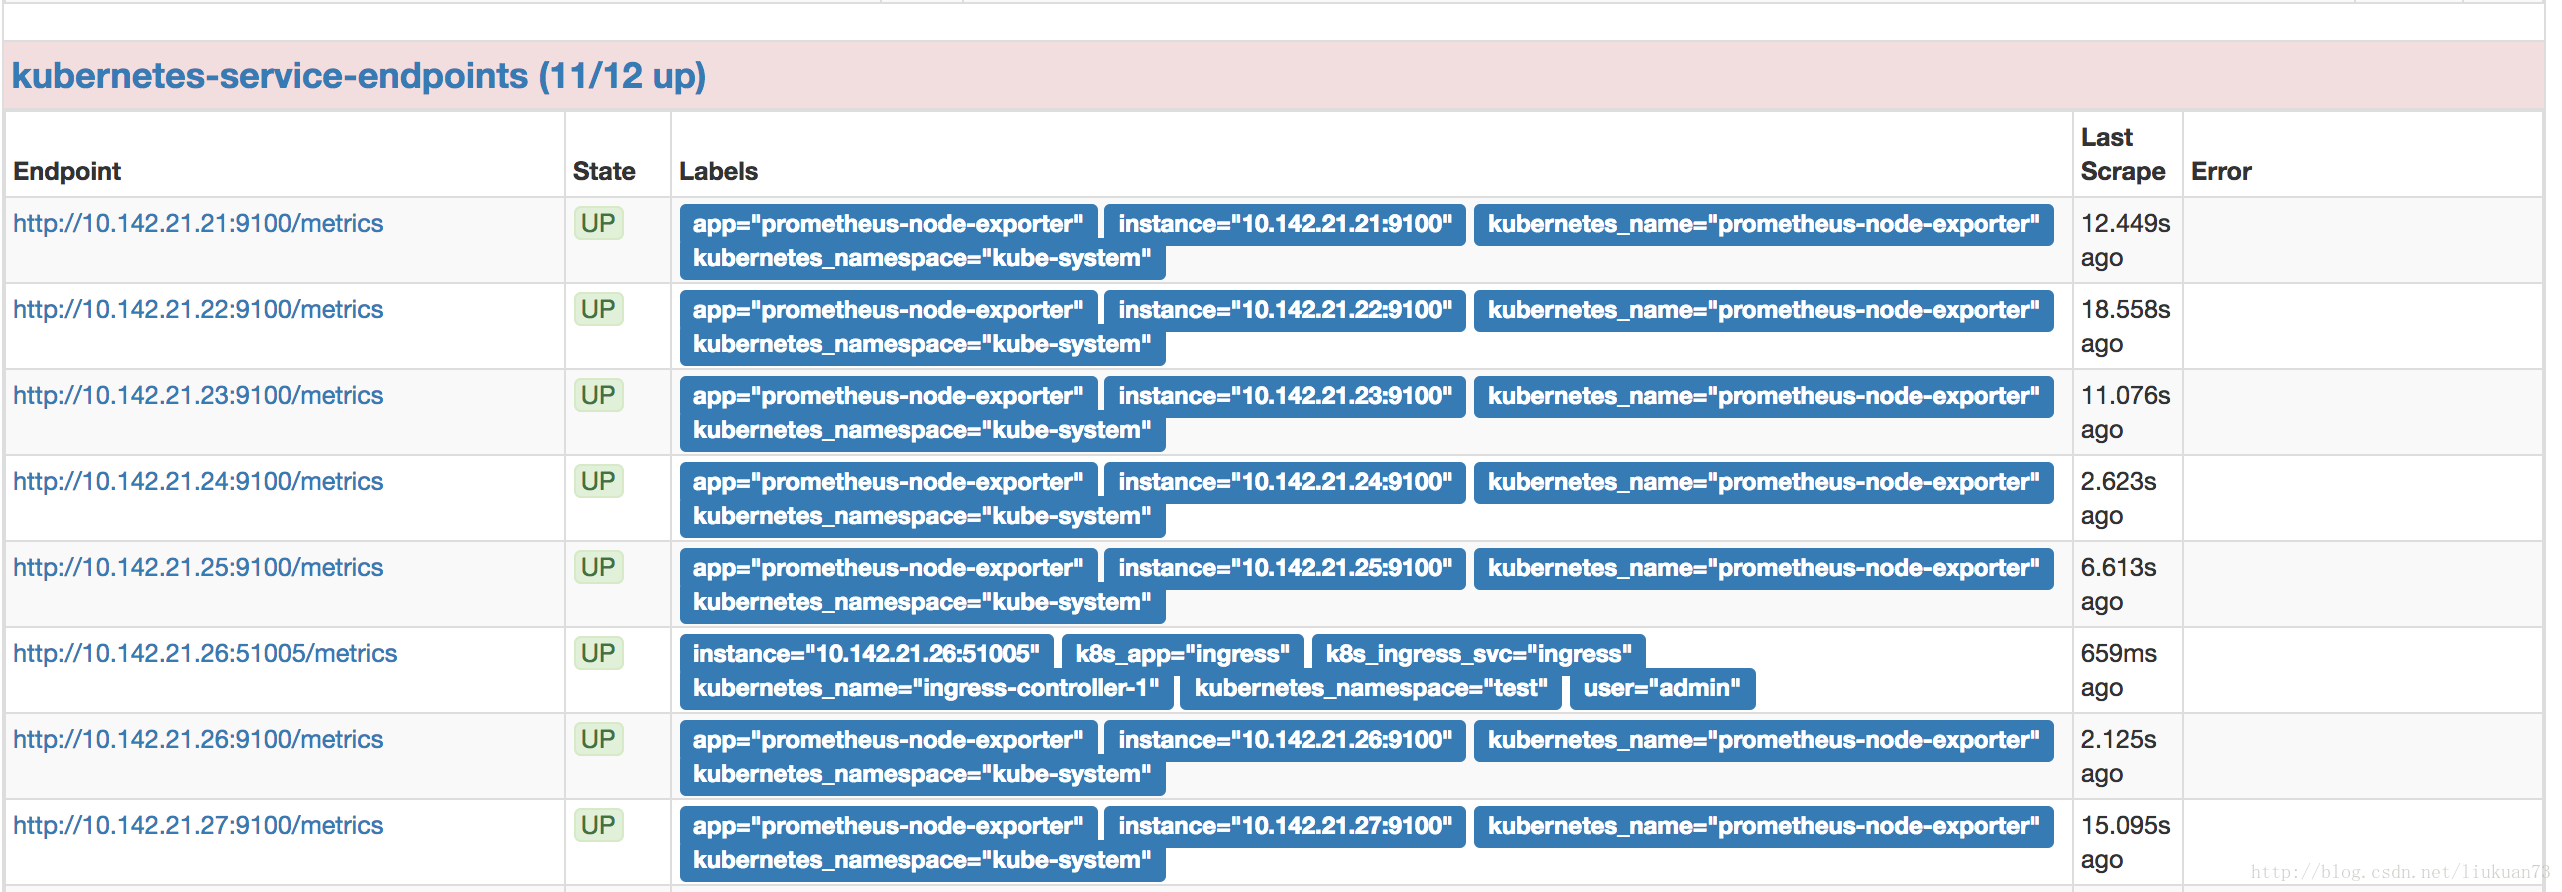
...- 在prometheus的target中可以看到采到信息:
2.3 资源对象的状态(deployment、pod等)—kube-state-metrics
- 附我的kube-state-metrics-deployment.yaml文件,包含serviceaccount、deployment、service(https://github.com/liukuan73/k8s-monitor):
apiVersion: v1
kind: ServiceAccount
metadata:
  name: kube-state-metrics
  namespace: kube-system
---
apiVersion: extensions/v1beta1
kind: Deployment
metadata:
  name: kube-state-metrics
  namespace: kube-system
  labels:
    app: kube-state-metrics
spec:
  replicas: 2
  strategy:
    rollingUpdate:
      maxSurge: 1
      maxUnavailable: 1
    type: RollingUpdate
  template:
    metadata:
      labels:
        app: kube-state-metrics
    spec:
      serviceAccountName: kube-state-metrics
      containers:
      - name: kube-state-metrics
        image: gcr.io/google_containers/kube-state-metrics:v1.1.0
        ports:
        - containerPort: 8080
      restartPolicy: Always
---
apiVersion: v1
kind: Service
metadata:
  annotations:
    prometheus.io/scrape: 'true'
  name: kube-state-metrics
  namespace: kube-system
  labels:
    app: kube-state-metrics
spec:
  type: NodePort
  ports:
  - name: kube-state-metrics
    port: 8080
    targetPort: 8080
    nodePort: 30008
  selector:
    app: kube-state-metrics
备注:
1.在Service中定义标注prometheus.io/scrape: ‘true’,表明该Service需要被promethues发现并采集数据
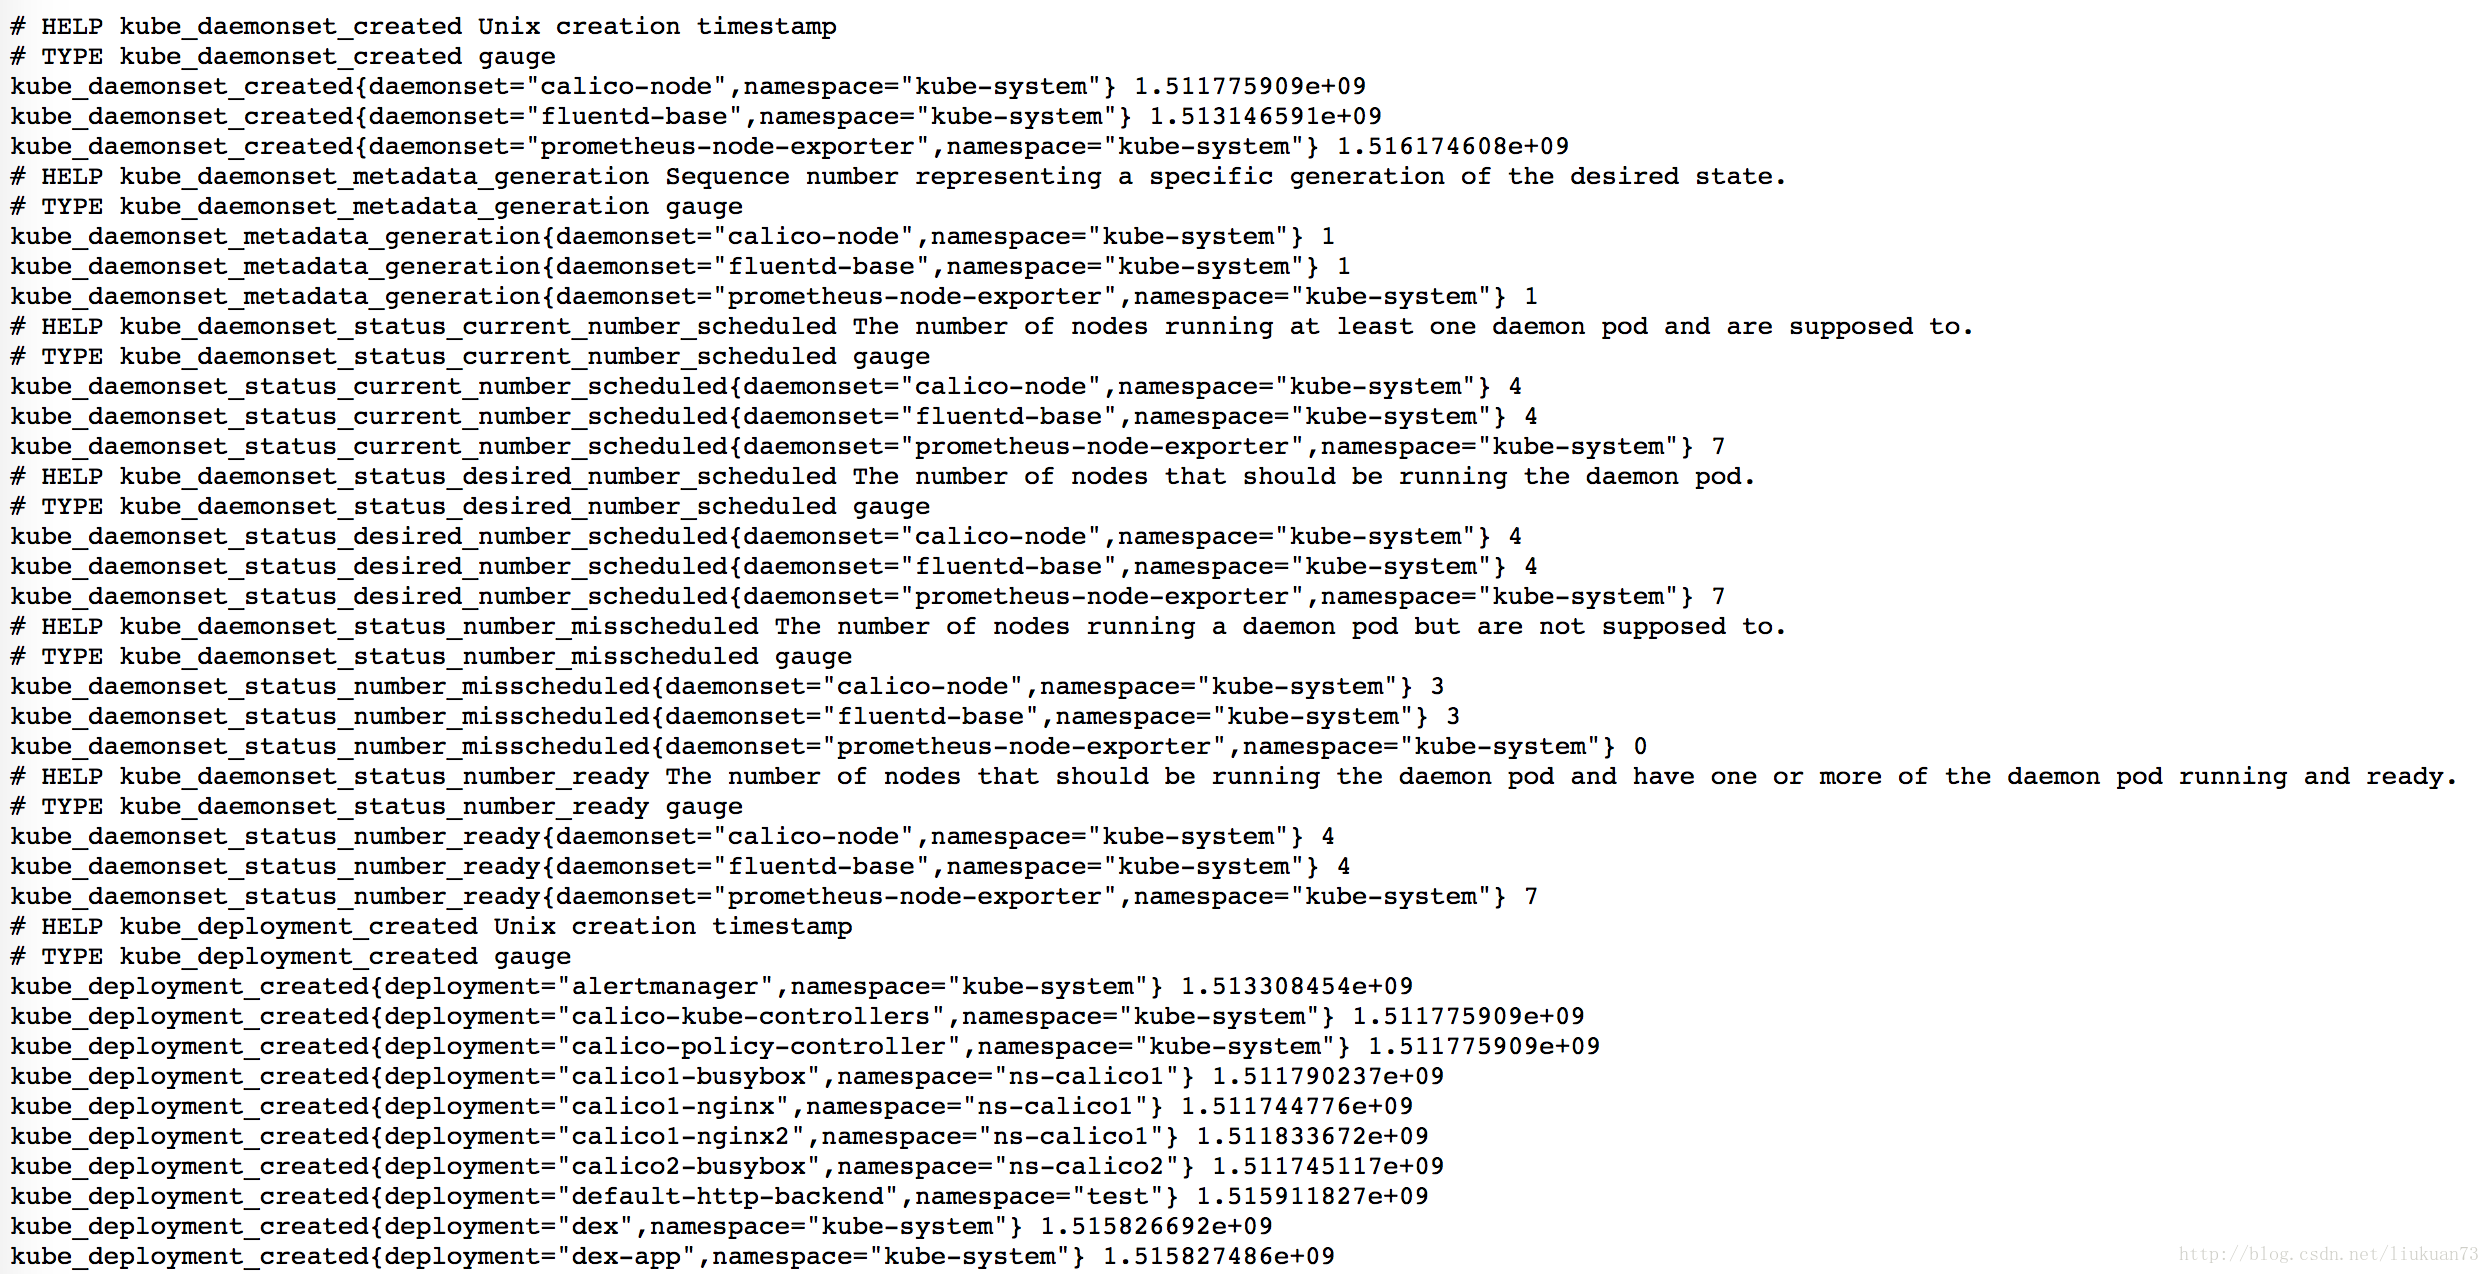
2.Promethues可以在容器内通过DNS地址 https://kubernetes.default.svc 访问kubernetes的Rest API.查看数据:http://nodeIP:30008/metrics,可以看到是以prometheus的格式输出:
- 在prometheus的target中可以看到采到信息(也是在kubernetes-service-endpoints里):

3. Prometheus部署和配置
前面第二章介绍了k8s平台的监控数据怎么采集出来,接下来介绍怎么用prometheus收集和处理,我的相关启动和配置文件请见:https://github.com/liukuan73/k8s-monitor
3.1 prometheus收集信息源的配置文件
configmap-prom-config-ssl.yaml
这个是prometheus的收集信息源的配置的相应configmap文件,我参考的这里:https://github.com/prometheus/prometheus/blob/master/documentation/examples/prometheus-kubernetes.yml,然后做适当改动并增加了一些注释。
prometheus的config文件的语法请见官网:https://prometheus.io/docs/prometheus/latest/configuration/configuration/
我改好的文件请见这里:https://github.com/liukuan73/k8s-monitor/blob/master/configmap-prom-config-ssl.yaml,其中有详细的注释。
3.2 prometheus告警规则配置文件
configmap-prom-rule.yaml,这个是prometheus的采集信息源的配置的相应configmap文件。
3.2.1 报警规则
报警规则允许你定义基于Prometheus语言表达的报警条件,并发送报警通知到外部服务。
3.2.1.1 定义报警规则
报警规则通过以下格式定义:
ALERT <alert name>
  IF <expression>
  [ FOR <duration> ]
  [ LABELS <label set> ]
  [ ANNOTATIONS <label set> ]
备注:
FOR子句使得Prometheus等待第一个传进来的向量元素(例如高HTTP错误的实例),并计数一个警报。如果元素是active,但是没有firing的,就处于pending状态。
LABELS(标签)子句允许指定一组附加的标签附到警报上。现有的任何标签都会被覆盖,标签值可以被模板化。
ANNOTATIONS(注释)子句指定另一组未查明警报实例的标签,它们被用于存储更长的其他信息,例如警报描述或者链接,注释值可以被模板化。
3.2.1.2 报警规则示例
# Alert for any instance that is unreachable for >5 minutes.
ALERT InstanceDown
  IF up == 0
  FOR 5m
  LABELS { severity = "page" }
  ANNOTATIONS {
    summary = "Instance {{ $labels.instance }} down",
    description = "{{ $labels.instance }} of job {{ $labels.job }} has been down for more than 5 minutes.",
  }

# Alert for any instance that have a median request latency >1s.
ALERT APIHighRequestLatency
  IF api_http_request_latencies_second{quantile="0.5"} > 1
  FOR 1m
  ANNOTATIONS {
    summary = "High request latency on {{ $labels.instance }}",
    description = "{{ $labels.instance }} has a median request latency above 1s (current value: {{ $value }}s)",
}- rules的config文件的详细语法请见:https://prometheus.io/docs/prometheus/latest/configuration/recording_rules/
- 我写好的文件请见这里:https://github.com/liukuan73/k8s-monitor/blob/master/configmap-alertmanager.yaml
3.3 prometheus启动文件
prometheus.yaml是prometheus以deployment起在kubernetes上的配置文件。
- 我写好的文件请见这里:https://github.com/liukuan73/k8s-monitor/blob/master/prometheus.yaml
- 启动后可以访问ip:nodePort/targets
4 告警组件Alertmanager介绍及部署
4.1 overview
Alertmanager与Prometheus是相互分离的两个部分。Prometheus服务器根据报警规则将警报发送给Alertmanager,然后Alertmanager将silencing、inhibition、aggregation等消息通过电子邮件、PaperDuty和HipChat发送通知。
设置警报和通知的主要步骤:
- 安装配置Alertmanager
- 配置Prometheus通过-alertmanager.url标志与Alertmanager通信
- 在Prometheus中创建告警规则
4.2 Alertmanager简介及机制
Alertmanager处理由类似Prometheus服务器等客户端发来的警报,之后需要删除重复、分组,并将它们通过路由发送到正确的接收器,比如电子邮件、Slack等。Alertmanager还支持沉默和警报抑制的机制。
分组
分组是指当出现问题时,Alertmanager会收到一个单一的通知,而当系统宕机时,很有可能成百上千的警报会同时生成,这种机制在较大的中断中特别有用。
例如,当数十或数百个服务的实例在运行,网络发生故障时,有可能服务实例的一半不可达数据库。在告警规则中配置为每一个服务实例都发送警报的话,那么结果是数百警报被发送至Alertmanager。
但是作为用户只想看到单一的报警页面,同时仍然能够清楚的看到哪些实例受到影响,因此,人们通过配置Alertmanager将警报分组打包,并发送一个相对看起来紧凑的通知。
分组警报、警报时间,以及接收警报的receiver是在配置文件中通过路由树配置的。
抑制
抑制是指当警报发出后,停止重复发送由此警报引发其他错误的警报的机制。
例如,当警报被触发,通知整个集群不可达,可以配置Alertmanager忽略由该警报触发而产生的所有其他警报,这可以防止通知数百或数千与此问题不相关的其他警报。
抑制机制可以通过Alertmanager的配置文件来配置。
沉默
沉默是一种简单的特定时间静音提醒的机制。一种沉默是通过匹配器来配置,就像路由树一样。传入的警报会匹配RE,如果匹配,将不会为此警报发送通知。
沉默机制可以通过Alertmanager的Web页面进行配置。
4.3 Alertmanager的配置
Alertmanager通过命令行flag和一个配置文件进行配置。命令行flag配置不变的系统参数、配置文件定义禁止规则、通知路由和通知接收器。
要查看所有可用的命令行flag,运行alertmanager -h。
Alertmanager在运行时加载配置,如果不能很好的形成新的配置,更改将不会被应用,并记录错误。
alertmanager详细配置说明请见官网:https://prometheus.io/docs/alerting/configuration/
Alertmanager can reload its configuration at runtime. If the new configuration is not well-formed, the changes will not be applied and an error is logged. A configuration reload is triggered by sending a SIGHUP to the process or sending a HTTP POST request to the /-/reload endpoint.
4.3.1 配置文件概要介绍
要指定加载的配置文件,需要使用-config.file标志(./alertmanager -config.file=simple.yml)。该文件使用YAML来完成,通过下面的描述来定义。括号内的参数是可选的,对于非列表的参数的值设置为指定的缺省值。
<duration>: a duration matching the regular expression [0-9]+(ms|[smhdwy])
<labelname>: a string matching the regular expression [a-zA-Z_][a-zA-Z0-9_]*
<labelvalue>: a string of unicode characters
<filepath>: a valid path in the current working directory
<boolean>: a boolean that can take the values true or false
<string>: a regular string
<secret>: a regular string that is a secret, such as a password
<tmpl_string>: a string which is template-expanded before usage
<tmpl_secret>: a string which is template-expanded before usage that is a secret
例子:
global:
  # ResolveTimeout is the time after which an alert is declared resolved
  # if it has not been updated.
  [ resolve_timeout: <duration> | default = 5m ]

  # The default SMTP From header field.
  [ smtp_from: <tmpl_string> ]
  # The default SMTP smarthost used for sending emails.
  [ smtp_smarthost: <string> ]
  # SMTP authentication information.
  [ smtp_auth_username: <string> ]
  [ smtp_auth_password: <secret> ]
  [ smtp_auth_secret: <secret> ]
  [ smtp_auth_identity: <string> ]
  # The default SMTP TLS requirement.
  [ smtp_require_tls: <bool> | default = true ]

  # The API URL to use for Slack notifications.
  [ slack_api_url: <string> ]
  [ victorops_api_key: <string> ]
  [ victorops_api_url: <string> | default = "https://alert.victorops.com/integrations/generic/20131114/alert/" ]
  [ pagerduty_url: <string> | default = "https://events.pagerduty.com/generic/2010-04-15/create_event.json" ]
  [ opsgenie_api_url: <string> | default = "https://api.opsgenie.com/" ]
  [ hipchat_url: <string> | default = "https://api.hipchat.com/" ]
  [ hipchat_auth_token: <secret> ]

# Files from which custom notification template definitions are read.
# The last component may use a wildcard matcher, e.g. 'templates/*.tmpl'.
templates:
  [ - <filepath> ... ]

# The root node of the routing tree.
route: <route>

# A list of notification receivers.
receivers:
  - <receiver> ...

# A list of inhibition rules.
inhibit_rules:
  [ - <inhibit_rule> ... ]
4.3.2 模块详解
4.3.2.1 路由模块 <route>
路由模块定义了路由树及其子节点。如果没有设置的话,子节点的可选配置参数从其父节点继承。
每个警报进入配置的路由树的顶级路径,顶级路径必须匹配所有警报(即没有任何形式的匹配)。然后匹配子节点。如果continue的值设置为false,它在匹配第一个孩子后就停止;如果在子节点匹配,continue的值为true,警报将继续进行后续兄弟姐妹的匹配。如果警报不匹配任何节点的任何子节点(没有匹配的子节点,或不存在),该警报基于当前节点的配置处理。
路由配置格式
[ receiver: <string> ]
[ group_by: '[' <labelname>, ... ']' ]

# Whether an alert should continue matching subsequent sibling nodes.
[ continue: <boolean> | default = false ]

# A set of equality matchers an alert has to fulfill to match the node.
match:
  [ <labelname>: <labelvalue>, ... ]

# A set of regex-matchers an alert has to fulfill to match the node.
match_re:
  [ <labelname>: <regex>, ... ]

# How long to initially wait to send a notification for a group
# of alerts. Allows to wait for an inhibiting alert to arrive or collect
# more initial alerts for the same group. (Usually ~0s to few minutes.)
[ group_wait: <duration> | default = 30s ]

# How long to wait before sending a notification about new alerts that
# are added to a group of alerts for which an initial notification has
# already been sent. (Usually ~5m or more.)
[ group_interval: <duration> | default = 5m ]

# How long to wait before sending a notification again if it has already
# been sent successfully for an alert. (Usually ~3h or more).
[ repeat_interval: <duration> | default = 4h ]

# Zero or more child routes.
routes:
  [ - <route> ... ]
示例:
# The root route with all parameters, which are inherited by the child
# routes if they are not overwritten.
route:
  receiver: 'default-receiver'
  group_wait: 30s
  group_interval: 5m
  repeat_interval: 4h
  group_by: [cluster, alertname]
  # All alerts that do not match the following child routes
  # will remain at the root node and be dispatched to 'default-receiver'.
  routes:
  # All alerts with service=mysql or service=cassandra
  # are dispatched to the database pager.
  - receiver: 'database-pager'
    group_wait: 10s
    match_re:
      service: mysql|cassandra
  # All alerts with the team=frontend label match this sub-route.
  # They are grouped by product and environment rather than cluster
  # and alertname.
  - receiver: 'frontend-pager'
    group_by: [product, environment]
    match:
      team: frontend
4.3.2.2 抑制规则模块 <inhibit_rule>
抑制规则,是存在另一组匹配器匹配的情况下,静音其他被引发警报的规则。这两个警报,必须有一组相同的标签。
抑制配置格式
# Matchers that have to be fulfilled in the alerts to be muted.
target_match:
  [ <labelname>: <labelvalue>, ... ]
target_match_re:
  [ <labelname>: <regex>, ... ]

# Matchers for which one or more alerts have to exist for the
# inhibition to take effect.
source_match:
  [ <labelname>: <labelvalue>, ... ]
source_match_re:
  [ <labelname>: <regex>, ... ]

# Labels that must have an equal value in the source and target
# alert for the inhibition to take effect.
[ equal: '[' <labelname>, ... ']' ]
4.3.2.3 接收器 <receiver>
顾名思义,警报接收的配置。
通用配置格式:
# The unique name of the receiver.
name: <string>

# Configurations for several notification integrations.
email_configs:
  [ - <email_config>, ... ]
hipchat_configs:
  [ - <hipchat_config>, ... ]
pagerduty_configs:
  [ - <pagerduty_config>, ... ]
pushover_configs:
  [ - <pushover_config>, ... ]
slack_configs:
  [ - <slack_config>, ... ]
opsgenie_configs:
  [ - <opsgenie_config>, ... ]
webhook_configs:
  [ - <webhook_config>, ... ]
victorops_configs:
[ - <victorops_config>, ... ]每个接收器具体怎么配,请看官方文档:https://prometheus.io/docs/alerting/configuration/
Alertmanager会使用以下的格式向配置端点发送HTTP POST请求:
{
  "version": "4",
  "groupKey": <string>,    // key identifying the group of alerts (e.g. to deduplicate)
  "status": "<resolved|firing>",
  "receiver": <string>,
  "groupLabels": <object>,
  "commonLabels": <object>,
  "commonAnnotations": <object>,
  "externalURL": <string>,  // backlink to the Alertmanager.
  "alerts": [
    {
      "labels": <object>,
      "annotations": <object>,
      "startsAt": "<rfc3339>",
      "endsAt": "<rfc3339>"
    },
    ...
  ]
}
4.4 alertmanager启动
相关文件请见:https://github.com/liukuan73/k8s-monitor
1.configmap-alertmanager.yaml
2.alertmanager.yaml
启动后可以在webui上查看告警信息:http://nodeIP:30010/alertmanager
5.可视化展示
安装grafana,grafana.yaml如下:
apiVersion: extensions/v1beta1
kind: Deployment
metadata:
  name: monitoring-grafana
  namespace: kube-system
spec:
  replicas: 1
  template:
    metadata:
      labels:
        task: monitoring
        k8s-app: grafana
    spec:
      containers:
      - name: grafana
        image: daocloud.io/liukuan73/heapster-grafana:v4.4.3
        imagePullPolicy: IfNotPresent
        ports:
        - containerPort: 3000
          protocol: TCP
        volumeMounts:
        - mountPath: /etc/ssl/certs
          name: ca-certificates
          readOnly: true
        - mountPath: /var
          name: grafana-storage
        env:
        - name: INFLUXDB_HOST
          value: monitoring-influxdb
        - name: GF_SERVER_HTTP_PORT
          value: "3000"
          # The following env variables are required to make Grafana accessible via
          # the kubernetes api-server proxy. On production clusters, we recommend
          # removing these env variables, setup auth for grafana, and expose the grafana
          # service using a LoadBalancer or a public IP.
        - name: GF_AUTH_BASIC_ENABLED
          value: "false"
        - name: GF_AUTH_ANONYMOUS_ENABLED
          value: "true"
        - name: GF_AUTH_ANONYMOUS_ORG_ROLE
          value: Admin
        - name: GF_SERVER_ROOT_URL
          # If you're only using the API Server proxy, set this value instead:
          # value: /api/v1/namespaces/kube-system/services/monitoring-grafana/proxy
          value: /
      volumes:
      - name: ca-certificates
        hostPath:
          path: /etc/ssl/certs
      - name: grafana-storage
        emptyDir: {}
      nodeSelector:
        node-type: master
      tolerations:
      - key: "master"
        operator: "Equal"
        value: "yes"
        effect: "NoSchedule"
---
apiVersion: v1
kind: Service
metadata:
  labels:
    # For use as a Cluster add-on (https://github.com/kubernetes/kubernetes/tree/master/cluster/addons)
    # If you are NOT using this as an addon, you should comment out this line.
    kubernetes.io/cluster-service: 'true'
    kubernetes.io/name: monitoring-grafana
  name: monitoring-grafana
  namespace: kube-system
spec:
  type: NodePort
  # In a production setup, we recommend accessing Grafana through an external Loadbalancer
  # or through a public IP.
  # type: LoadBalancer
  # You could also use NodePort to expose the service at a randomly-generated port
  # type: NodePort
  ports:
  - port: 80
    targetPort: 3000
    nodePort: 30002
  selector:
    k8s-app: grafana
6. Prometheus介绍
Prometheus是CNCF 下继 K8S 之后第二个项目。它们的开发人员都是原 Google 的 SRE,通过 HTTP 的方式来做数据收集,对其最深远的应该是其被设计成一个 self sustained 的系统,也就是说它是完全独立的系统,不需要外部依赖。它是独立的一个系统,它自己的存储都是存在本地,没有考虑用一些外部存储来持久化这些数据,所以它不是持久的数据库。它只可以保存一周或者几周的数据,方便你去做一个监控。
组成及架构
架构图如下:
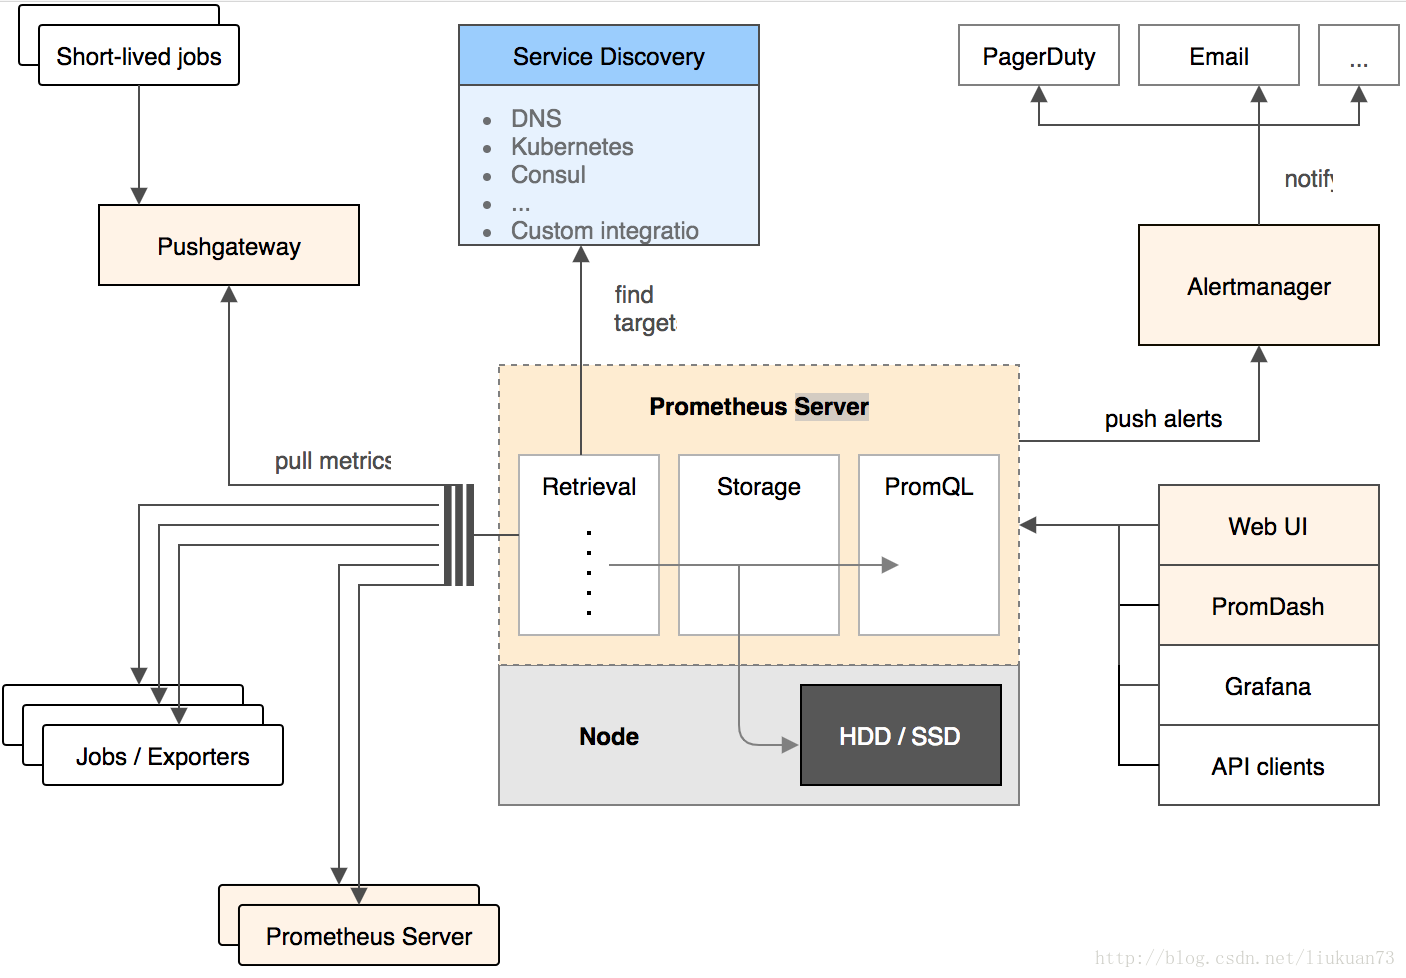
- Prometheus server
主要负责数据采集和存储,提供PromQL查询语言的支持 - 客户端sdk
官方提供的客户端类库有go、java、scala、python、ruby,其他还有很多第三方开发的类库,支持nodejs、php、erlang等 - Push Gateway
支持临时性Job主动推送指标的中间网关 - PromDash
使用rails开发的dashboard,用于可视化指标数据 - exporters
支持其他数据源的指标导入到Prometheus,支持数据库、硬件、消息中间件、存储系统、http服务器、jmx等 - alertmanager
实验性组件、用来进行报警 - prometheus_cli
命令行工具 - 其他辅助性工具
它的服务过程是这样的 Prometheus daemon 负责定时去目标上抓取 metrics(指标) 数据,每个抓取目标需要暴露一个http服务的接口给它定时抓取。
Prometheus支持通过配置文件、文本文件、zookeeper、Consul、DNS SRV lookup等方式指定抓取目标。
Alertmanager 是独立于Prometheus的一个组件,可以支持Prometheus的查询语句,提供十分灵活的报警方式。
Prometheus支持很多方式的图表可视化,例如十分精美的Grafana,自带的Promdash,以及自身提供的模版引擎等等,还提供HTTP API的查询方式,自定义所需要的输出。
PushGateway这个组件是支持Client主动推送 metrics 到PushGateway,而Prometheus只是定时去Gateway上抓取数据。
Prometheus特点
- 多维数据模型(时序列数据由metric名和一组key/value组成)
- 在多维度上灵活的查询语言(PromQl)
- 不依赖分布式存储,单主节点工作.
- 通过基于HTTP的pull方式采集时序数据
- 可以通过push gateway进行时序列数据推送(pushing)
- 可以通过服务发现或者静态配置去获取要采集的目标服务器
- 多种可视化图表及仪表盘支持
Prometheus 的数据模型
Prometheus 从根本上所有的存储都是按时间序列去实现的,相同的 metrics(指标名称) 和 label(一个或多个标签) 组成一条时间序列,不同的label表示不同的时间序列。为了支持一些查询,有时还会临时产生一些时间序列存储。
metrics name & label 指标名称和标签
每条时间序列是由唯一的 指标名称 和 一组 标签 (key=value)的形式组成。
指标名称一般是给监测对像起一名字,例如 http_requests_total 这样,它有一些命名规则,可以包字母数字之类的的。通常是以应用名称开头监测对像数值类型单位这样。例如:
push_total
userlogin_mysql_duration_seconds
app_memory_usage_bytes标签就是对一条时间序列不同维度的识别了,例如一个http请求用的是POST还是GET,它的endpoint是什么,这时候就要用标签去标记了。
最终形成的标识便是这样:
http_requests_total{method="POST",endpoint="/api/tracks"}- 记住,针对http_requests_total这个metrics name 无论是增加标签还是删除标签都会形成一条新的时间序列。
查询语句就可以跟据上面标签的组合来查询聚合结果了。
如果以传统数据库的理解来看这条语句,则可以考虑 http_requests_total是表名,标签是字段,而timestamp是主键,还有一个float64字段是值(Prometheus里面所有值都是按float64存储)
Prometheus 的四种数据类型
Counter
- Counter 用于累计值,例如记录请求次数、任务完成数、错误发生次数。
- 一直增加,不会减少。
- 重启进程后,会被重置。
例如:http_response_total{method="GET",endpoint="/api/tracks"} 100
10秒后抓取 http_response_total{method="GET",endpoint="/api/tracks"} 100
Gauge
- Gauge 常规数值,例如 温度变化、内存使用变化。
- 可变大,可变小。
- 重启进程后,会被重置
例如: memory_usage_bytes{host="master-01"} 100 < 抓取值
memory_usage_bytes{host="master-01"} 30
memory_usage_bytes{host="master-01"} 50
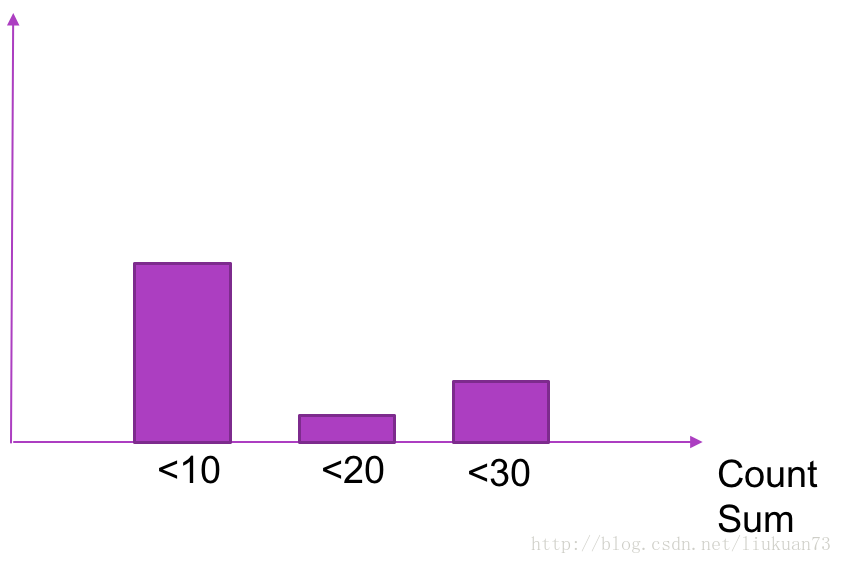
memory_usage_bytes{host="master-01"} 80 < 抓取值Histogram
- Histogram 可以理解为柱状图的意思,常用于跟踪事件发生的规模,例如:请求耗时、响应大小。它特别之处是可以对记录的内容进行分组,提供 count 和 sum 全部值的功能。
例如:{小于10=5次,小于20=1次,小于30=2次},count=7次,sum=7次的求和值
Summary
- Summary和Histogram十分相似,常用于跟踪事件发生的规模,例如:请求耗时、响应大小。同样提供 count 和 sum 全部值的功能。
- 例如:count=7次,sum=7次的值求值
- 它提供一个quantiles的功能,可以按%比划分跟踪的结果。例如:quantile取值0.95,表示取采样值里面的95%数据。
Prometheus数据采集方式
- pull方式
Prometheus采集数据是用的pull也就是拉模型,通过HTTP协议去采集指标,只要应用系统能够提供HTTP接口就可以接入监控系统,相比于私有协议或二进制协议来说开发、简单。 - push方式
对于定时任务这种短周期的指标采集,如果采用pull模式,可能造成任务结束了,Prometheus还没有来得及采集,这个时候可以使用加一个中转层,客户端推数据到Push Gateway缓存一下,由Prometheus从push gateway pull指标过来。(需要额外搭建Push Gateway,同时需要新增job去从gateway采数据)
STORAGE 存储
Prometheus有一个复杂的本地存储子系统。对于索引,它使用levelDB。对于批量的样本数据,它由自己的自定义存储层,并以固定大小(1024个字节有效负载)的块组织样本数据。然后将这些块存储在每个时间序列的一个文件中的磁盘上。
其他
Memory usage 内存使用量
Prometheus将所有当前使用的块保留在内存中。此外,它将最新使用的块保留在内存中,最大内存可以通过storage.local.memory-chunks标志配置。如果你有较多的可用内存,你可能希望将其增加到默认值1048576字节以上(反之亦然,如果遇到RAM问题,可以尝试减少内存值)。请注意,服务器的实际RAM使用率将高于将storage.local.memory-chunks*1024字节所期望的RAM使用率。管理存储层中的样本数据是不可避免的开销。此外,服务器正在做更多的事情,而不仅仅存储样本数据。实际开销取决于你的使用模式。在极端情况下,Prometheus必须保持更多的内存块,而不是配置,因为所有这些块都在同一时间使用。你必须试一下。Prometheus导出导出的度量指标prometheus_local_storage_memory_chunks和process_resident_memory_bytes将派上用场。作为经验法则,你应该至少拥有内存块所需三倍以上。
设计到大量时间序列的PromQL查询大量使用LevelDB支持的索引。如果需要运行这种查询,则可能需要调整索引缓存大小。以下标志是相关的:
-storage.local.index-cache-size.label-name-to-label-values: 正则表达式匹配
-storage.local.index-cache-size.label-pair-to-fingerprints: 如果大量的时间序列共享相同的标签,增加内存大小
-storage.local.index-cache-size.fingerprint-to-metric and -storage.local.index-cache-size.fingerprint-to-timerange: 如果你有大量的目标时间序列,例如:一段时间还没有被接收的样本数据时间序列,但是数据又还没有失效。这时也需要增加内存.
你必须尝试使用flag,才能找出有用的。如果一个查询触及到100000多个时间序列数据,几百M内存使用可能是合理的。如果你有足够的内存可用,对于LevelDB使用更多的内存不会有任何伤害。
磁盘使用量 disk usage
Prometheus存储时间序列在磁盘上,目录由flag storage.local.path指定。默认path是./data(关联到工作目录),这是很好的快速尝试,但很可能不是你想要的实际操作。这个flagstroage.local.retention允许你配置这个保留的样本数据。根据你的需求和你的可用磁盘空间做出合适的调整。
Chunking encoding
Prometheus当前提供三种不同类型的块编码(chunk encodings)。对于新创建块的编码由flag -storage.local.chunk-encoding-version决定。 有效值分别是0,1和2.
对于Prometheus的第一块存储存,类型值为0实现了delta编码。类型值为1是当前默认编码, 这是有更好的压缩算法的双delta编码,比类型值为0的delta编码要好。这两种编码在整个块中都具有固定的每个样本字节宽度,这允许快速随机访问。然而类型值为0 的delta编码是最快的编码,与类型值为1的编码相比,编码成本的差异很小。由于具有更好的压缩算法的编码1,除了兼容Prometheus更老的版本,一般建议使用编码1。
类型2是可变宽度的编码,例如:在块中的每个样本能够使用一个不同数量的bit位数。时间戳也是双delta编码。但是算法稍微有点不同。一些不同编码范式对于样本值都是可用的。根据样本值类型来决定使用哪种编码范式,样本值类型有:constant,int型,递增,随机等
编码2的主要部分的灵感来源于Facebook工程师发表的一篇论文:Gorilla: A Fast, Scalable, In-Memory Time Series Database
编码2必须顺序地访问块,并且编解码的代价比较高。总体来看,对比编码1,编码2造成了更高的CPU使用量和增加了查询延时,但是它提供一个改进的压缩比。准确值非常依赖于数据集和查询类型。下面的结果来自典型的生产环境的服务器中: | 块编码类型 | 每个样本数据占用的比特位数 | CPU核数 | 规则评估时间 | | ———- | ————————-: | ——-:| :———-: | | 1 | 3.3 | 1.6 | 2.9s | | 2 | 1.3 | 2.4 | 4.9s |
每次启动Prometheus服务时,你可以改变块的编码类型,因此在实验中测试不同编码类型是我们非常鼓励的。但是考虑到,仅仅是新创建的块会使用新选择块编码,因此你将需要一段时间才能看到效果。
设置大量时间序列数据
Prometheus能够处理百万级别的时间序列数据。然而,你必须调整存储设置到处理多余100000活跃的时间序列。基本上,对于每个时间序列要存储到内存中,你想要允许这几个确定数量的块。对于storage.local.memory-chunksflag标志的默认值是1048567。高达300000个时间序列时,平均来看,每个时间序列仍然有三个可用的块。对于更多的时间序列,应该增加storage.local.memory-chunks值。三倍于时间序列的数量是一个非常好的近似值。但请注意内存使用的含义(见上文)。
如果你比配置的内存块有更多的时间序列数据,Prometheus不可避免地遇到一种情况,它必须保持比配置更多的内存块。如果使用块数量超过配置限制的10%, Prometheus将会减少获取的样本数据量(通过skip scrape和rule evaluation)直到减少到超过配置的5%。减少获取样本数量是非常糟糕的情况,这是你我都不愿意看到的。
同样重要地,特别是如果写入磁盘,会增长storage.local.max-chunks-to-persistflag值。根据经验,保持它是storage.local.memory-chunks值的50%是比较好的。storage.local.max-chunks-to-persist控制了多少块等待写入到你的存储设备,它既可以是spinning磁盘,也可以是SSD。如果等待块过多,这Prometheus将会减少获取样本数量,知道等待写入的样本数量下降到配置值的95%以下。在发生这种情况之前,Prometheus试着加速写入块。详见文档
每个时间序列可以保留更多的内存块,你就可以批量编写更多的写操作。对spinning磁盘是相当重要的。注意每个活跃的时间序列将会有个不完整的头块,目前还不能被持久化。它是在内存的块,不是磁盘块数据。如果你有1M的活跃时间序列数据,你需要3Mstorage.local.memory-chunks块,为每个时间序列提供可用的3块内存。仅仅有2M可持久化,因此设置storage.local.max-to-persist值大于2M,可以很容易地让内存超过3M块。尽管存储storage.local.memory-chunks的设置,这再次导致可怕的减少样本数量(Prometheus服务将尽快再此出现之前加速消费)。
等待持久性块的高价值的另一个缺点是检查点较大。
如果将大量时间序列与非常快速和/或较大的scrapes相结合,则预先分配的时间序列互斥所可能不会很奏效。如果你在Prometheus服务正在编写检查点或者处理代价大的查询时,看到获取较慢,请尝试增加storage.local.num-fingerprint-mutexesflag值。有时需要数万甚至更多。
持续压力和“冲动模式” Persist pressure and “rushed mode”
本质上,Prometheus服务将尽可能快递将完成的块持久化到磁盘上。这样的策略可能会导致许多小的写入操作,会占用更多的I/O带宽并保持服务器的繁忙。spinning磁盘在这里更加敏感,但是即使是SSD也不会喜欢这样。Prometheus试图尽可能的批量编写写操作,如果允许使用更多的内存,这样做法更好。因此,将上述flag设置为导致充分利用可用内存的值对于高性能非常重要。
Prometheus还将在每次写入后同步时间序列文件(使用storage.local.series-sync-strategy = adaptive, 这是默认值), 并将磁盘带宽用于更频繁的检查点(根据“脏的时间序列”的计数,见下文),都试图在崩溃的情况下最小化数据丢失。
但是,如果等待写入的块数量增长太多,怎么办?Prometheus计算一个持久块的紧急度分数,这取决于等待与storage.local.max-chunks-to-persist值相关的持久性的快数量,以及内存中的快数量超过存储空间的数量。local.memory-chunks值(如果有的话,只有等待持久性的块的最小数量,以便更快的帮助)。分数在0~1.其中1是指对应于最高的紧急程度。根据得分,Prometheus将更频繁地写入磁盘。如果得分超过0.8的门槛,Prometheus将进入“冲动模式”(你可以在日志中国看到)。在冲动模式下,采用以下策略来加速持久化块:
时间序列文件不再在写操作之后同步(更好地利用操作系统的页面缓存,在服务器崩溃的情况下,丢失数据的风险会增加), 这个行为通过storage.local.series-sync-strategyflag。
检查点仅仅通过storage.local.checkpoint-intervalflag启动配置时创建(对于持久化块,以崩溃的情况下更多丢失数据的代码和运行随后崩溃恢复的时间增加,来释放更多的磁盘带宽)
对于持久化块的写操作不再被限制,并且尽可能快地执行。
一段得分下降到0.7以下,Prometheus将退出冲动模式。
设置更长的保留时间 setting for very long retention time
如果你有通过storage.local.retentionflag(超过一个月), 设置一个更长的留存时间,你可能想要增加storage.local.series-file-shrink-ratioflag值。
每当Prometheus需要从一系列文件的开头切断一些块时,它将简单地重写整个文件。(某些文件系统支持“头截断”,Prometheus目前由于几个原因目前不使用)。为了不重写一个非常大的系列文件来摆脱很少的块,重写只会发生在至少10%的块中 系列文件被删除。 该值可以通过上述的storage.local.series-file-shrink-ratioflag来更改。 如果您有很多磁盘空间,但希望最小化重写(以浪费磁盘空间为代价),请将标志值增加到更高的值,例如。 30%所需的块删除为0.3。
有用的度量指标
在Prometheus暴露自己的度量指标之外,以下内容对于调整上述flag特别有用:
prometheus_local_storage_memory_series: 时间序列持有的内存当前块数量
prometheus_local_storage_memory_chunks: 在内存中持久块的当前数量
prometheus_local_storage_chunks_to_persist: 当前仍然需要持久化到磁盘的的内存块数量
prometheus_local_storage_persistence_urgency_score: 上述讨论的紧急程度分数
如果Prometheus处于冲动模式下,prometheus_local_storage_rushed_mode值等于1; 否则等于0.
Crash恢复 Carsh Recovery
Prometheus在完成后尽快将块保存到磁盘。常规检查点中不完整的块保存到磁盘。您可以使用storage.local.checkpoint-intervalflag配置检查点间隔。如果太多的时间序列处于“脏”状态,那么Prometheus更频繁地创建检查点,即它们当前的不完整的头部块不是包含在最近检查点中的。此限制可通过storage.local.checkpoint-dirty-series-limitflag进行配置。
然而,如果您的服务器崩溃,您可能仍然丢失数据,并且您的存储空间可能处于不一致的状态。因此,Prometheus在意外关机后执行崩溃恢复,类似于文件系统的fsck运行。将记录关于崩溃恢复的详细信息,因此如果需要,您可以将其用于取证。无法恢复的数据被移动到名为孤立的目录(位于storage.local.path下)。如果不再需要,请记住删除该数据。
崩溃恢复通常需要不到一分钟。如果需要更长时间,请咨询日志,以了解出现的问题。
Data corrution 数据损坏
如果您怀疑数据库中的损坏引起的问题,则可以通过使用storage.local.dirtyflag启动服务器来强制执行崩溃恢复。
如果没有帮助,或者如果您只想删除现有的数据库,可以通过删除存储目录的内容轻松地启动:
stop prometheus.
rm -r /*
start prometheus
1.https://github.com/prometheus/prometheus/blob/master/documentation/examples/prometheus-kubernetes.yml
2.http://blog.csdn.net/wiborgite/article/details/52870819
3.http://blog.csdn.net/wenwst/article/details/76624019
4.https://www.kubernetes.org.cn/1954.html
5.https://www.cnblogs.com/vovlie/p/Prometheus_CONCEPTS.html
6.https://www.jianshu.com/p/36f72490a2a0
7.https://github.com/1046102779/prometheus/blob/master/operating/storage.md
8.http://blog.csdn.net/y_xiao_/article/details/50818451