import numpy as np
import matplotlib.pyplot as plt

fig = plt.figure()
fig.subplots_adjust(bottom=0.025, left=0.025, top = 0.975, right=0.975)

plt.subplot(2,1,1)
plt.xticks([]), plt.yticks([])

plt.subplot(2,3,4)
plt.xticks([]), plt.yticks([])

plt.subplot(2,3,5)
plt.xticks([]), plt.yticks([])

plt.subplot(2,3,6)
plt.xticks([]), plt.yticks([])

# plt.savefig('../figures/multiplot_ex.png',dpi=48)
plt.show()
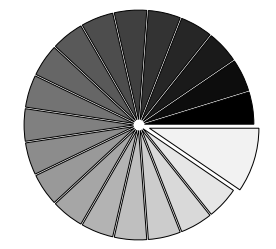
import numpy as np
import matplotlib.pyplot as plt

n = 20
Z = np.ones(n)
Z[-1] *= 2

plt.axes([0.025, 0.025, 0.95, 0.95])

plt.pie(Z, explode=Z*.05, colors=['%f' % (i/float(n)) for i in range(n)],
        wedgeprops={"linewidth": 1, "edgecolor": "black"})
plt.gca().set_aspect('equal')
plt.xticks([]), plt.yticks([])

# savefig('../figures/pie_ex.png',dpi=48)
plt.show()
import numpy as np
import matplotlib.pyplot as plt

n = 256
X = np.linspace(-np.pi,np.pi,n,endpoint=True)
Y = np.sin(2*X)

plt.axes([0.025,0.025,0.95,0.95])

plt.plot (X, Y+1, color='blue', alpha=1.00)
plt.fill_between(X, 1, Y+1, color='blue', alpha=.25)

plt.plot (X, Y-1, color='blue', alpha=1.00)
plt.fill_between(X, -1, Y-1, (Y-1) > -1, color='blue', alpha=.25)
plt.fill_between(X, -1, Y-1, (Y-1) < -1, color='red',  alpha=.25)

plt.xlim(-np.pi,np.pi), plt.xticks([])
plt.ylim(-2.5,2.5), plt.yticks([])
# savefig('../figures/plot_ex.png',dpi=48)
plt.show()

import numpy as np
import matplotlib.pyplot as plt
from mpl_toolkits.mplot3d import Axes3D

fig = plt.figure()
ax = Axes3D(fig)
X = np.arange(-4, 4, 0.25)
Y = np.arange(-4, 4, 0.25)
X, Y = np.meshgrid(X, Y)
R = np.sqrt(X**2 + Y**2)
Z = np.sin(R)

ax.plot_surface(X, Y, Z, rstride=1, cstride=1, cmap=plt.cm.hot)
ax.contourf(X, Y, Z, zdir='z', offset=-2, cmap=plt.cm.hot)
ax.set_zlim(-2,2)

# savefig('../figures/plot3d_ex.png',dpi=48)
plt.show()

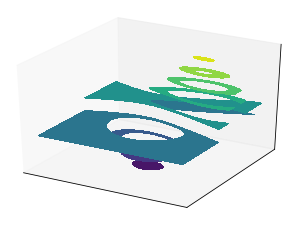
from pylab import *
from mpl_toolkits.mplot3d import axes3d


ax = gca(projection='3d')
X, Y, Z = axes3d.get_test_data(0.05)
cset = ax.contourf(X, Y, Z)
ax.clabel(cset, fontsize=9, inline=1)

plt.xticks([]), plt.yticks([]),
ax.set_zticks([])

ax.text2D(-0.05, 1.05, " 3D plots \n\n",
          horizontalalignment='left',
          verticalalignment='top',
          family='Lint McCree Intl BB',
          size='x-large',
          bbox=dict(facecolor='white', alpha=1.0, width=350,height=60),
          transform = gca().transAxes)

ax.text2D(-0.05, .975, " Plot 2D or 3D data",
          horizontalalignment='left',
          verticalalignment='top',
          family='Lint McCree Intl BB',
          size='medium',
          transform = gca().transAxes)

plt.show()
import numpy as np
import matplotlib.pyplot as plt

ax = plt.axes([0.025,0.025,0.95,0.95], polar=True)

N = 20
theta = np.arange(0.0, 2*np.pi, 2*np.pi/N)
radii = 10*np.random.rand(N)
width = np.pi/4*np.random.rand(N)
bars = plt.bar(theta, radii, width=width, bottom=0.0)

for r,bar in zip(radii, bars):
    bar.set_facecolor( plt.cm.jet(r/10.))
    bar.set_alpha(0.5)

ax.set_xticklabels([])
ax.set_yticklabels([])
# savefig('../figures/polar_ex.png',dpi=48)
plt.show()

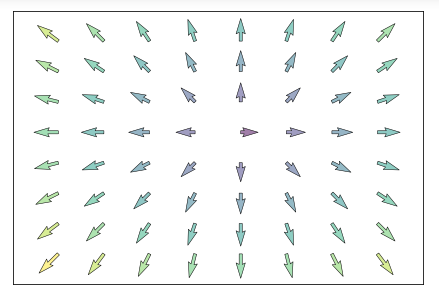
import numpy as np
import matplotlib.pyplot as plt

n = 8
X,Y = np.mgrid[0:n,0:n]
T = np.arctan2(Y-n/2.0, X-n/2.0)
R = 10+np.sqrt((Y-n/2.0)**2+(X-n/2.0)**2)
U,V = R*np.cos(T), R*np.sin(T)

plt.axes([0.025,0.025,0.95,0.95])
plt.quiver(X,Y,U,V,R, alpha=.5)
plt.quiver(X,Y,U,V, edgecolor='k', facecolor='None', linewidth=.5)

plt.xlim(-1,n), plt.xticks([])
plt.ylim(-1,n), plt.yticks([])

# savefig('../figures/quiver_ex.png',dpi=48)
plt.show()
import numpy as np
import matplotlib
import matplotlib.pyplot as plt
from matplotlib.animation import FuncAnimation

# No toolbar
matplotlib.rcParams['toolbar'] = 'None'

# New figure with white background
fig = plt.figure(figsize=(6,6), facecolor='white')

# New axis over the whole figureand a 1:1 aspect ratio
# ax = fig.add_axes([0,0,1,1], frameon=False, aspect=1)
ax = fig.add_axes([0.005,0.005,0.990,0.990], frameon=True, aspect=1)

# Number of ring
n = 50
size_min = 50
size_max = 50*50

# Ring position
P = np.random.uniform(0,1,(n,2))

# Ring colors
C = np.ones((n,4)) * (0,0,0,1)

# Alpha color channel goes from 0 (transparent) to 1 (opaque)
C[:,3] = np.linspace(0,1,n)

# Ring sizes
S = np.linspace(size_min, size_max, n)

# Scatter plot
scat = ax.scatter(P[:,0], P[:,1], s=S, lw = 0.5,
                  edgecolors = C, facecolors='None')

# Ensure limits are [0,1] and remove ticks
ax.set_xlim(0,1), ax.set_xticks([])
ax.set_ylim(0,1), ax.set_yticks([])


def update(frame):
    global P, C, S

    # Every ring is made more transparent
    C[:,3] = np.maximum(0, C[:,3] - 1.0/n)

    # Each ring is made larger
    S += (size_max - size_min) / n

    # Reset ring specific ring (relative to frame number)
    i = frame % 50
    P[i] = np.random.uniform(0,1,2)
    S[i] = size_min
    C[i,3] = 1

    # Update scatter object
    scat.set_edgecolors(C)
    scat.set_sizes(S)
    scat.set_offsets(P)
    return scat,

animation = FuncAnimation(fig, update, interval=10)
# animation.save('../figures/rain.gif', writer='imagemagick', fps=30, dpi=72)
plt.show()

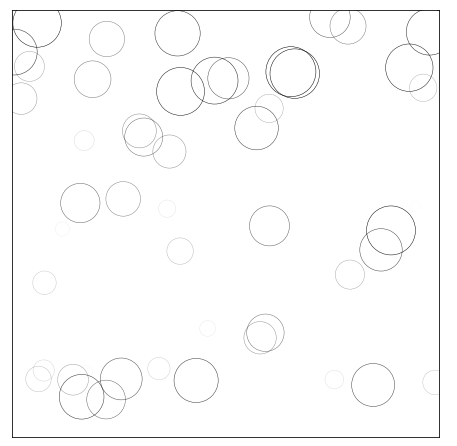
import numpy as np
import matplotlib.pyplot as plt

# New figure with white background
fig = plt.figure(figsize=(6,6), facecolor='white')

# New axis over the whole figureand a 1:1 aspect ratio
ax = fig.add_axes([0.005,0.005,.99,.99], frameon=True, aspect=1)

# Number of ring
n = 50
size_min = 50
size_max = 50*50

# Ring position
P = np.random.uniform(0,1,(n,2))

# Ring colors
C = np.ones((n,4)) * (0,0,0,1)

# Alpha color channel goes from 0 (transparent) to 1 (opaque)
C[:,3] = np.linspace(0,1,n)

# Ring sizes
S = np.linspace(size_min, size_max, n)

# Scatter plot
scat = ax.scatter(P[:,0], P[:,1], s=S, lw = 0.5,
                  edgecolors = C, facecolors='None')

# Ensure limits are [0,1] and remove ticks
ax.set_xlim(0,1), ax.set_xticks([])
ax.set_ylim(0,1), ax.set_yticks([])

# plt.savefig("../figures/rain-static.png",dpi=72)
plt.show()
import numpy as np
import matplotlib.pyplot as plt

n = 1024
X = np.random.normal(0,1,n)
Y = np.random.normal(0,1,n)
T = np.arctan2(Y,X)

plt.axes([0.025,0.025,0.95,0.95])
plt.scatter(X,Y, s=75, c=T, alpha=.5)

plt.xlim(-1.5,1.5), plt.xticks([])
plt.ylim(-1.5,1.5), plt.yticks([])
# savefig('../figures/scatter_ex.png',dpi=48)
plt.show()

from pylab import *

size = 256,16
dpi = 72.0
figsize= size[0]/float(dpi),size[1]/float(dpi)
fig = figure(figsize=figsize, dpi=dpi)
fig.patch.set_alpha(0)
axes([0,0,1,1], frameon=False)

plot(np.arange(4), np.ones(4), color="blue", linewidth=8, solid_capstyle = 'butt')

plot(5+np.arange(4), np.ones(4), color="blue", linewidth=8, solid_capstyle = 'round')

plot(10+np.arange(4), np.ones(4), color="blue", linewidth=8, solid_capstyle = 'projecting')

xlim(0,14)
xticks([]),yticks([])
show()

from pylab import *

size = 256,16
dpi = 72.0
figsize= size[0]/float(dpi),size[1]/float(dpi)
fig = figure(figsize=figsize, dpi=dpi)
fig.patch.set_alpha(0)
axes([0,0,1,1], frameon=False)

plot(np.arange(3), [0,1,0], color="blue", linewidth=8, solid_joinstyle = 'miter')
plot(4+np.arange(3), [0,1,0], color="blue", linewidth=8, solid_joinstyle = 'bevel')
plot(8+np.arange(3), [0,1,0], color="blue", linewidth=8, solid_joinstyle = 'round')

xlim(0,12), ylim(-1,2)
xticks([]),yticks([])
show()

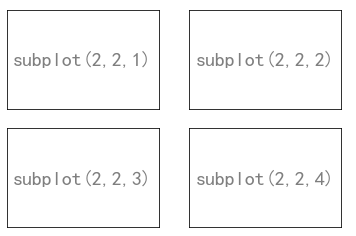
from pylab import *

subplot(2,2,1)
xticks([]), yticks([])
text(0.5,0.5, 'subplot(2,2,1)',ha='center',va='center',size=20,alpha=.5)

subplot(2,2,2)
xticks([]), yticks([])
text(0.5,0.5, 'subplot(2,2,2)',ha='center',va='center',size=20,alpha=.5)

subplot(2,2,3)
xticks([]), yticks([])
text(0.5,0.5, 'subplot(2,2,3)',ha='center',va='center',size=20,alpha=.5)

subplot(2,2,4)
xticks([]), yticks([])
text(0.5,0.5, 'subplot(2,2,4)',ha='center',va='center',size=20,alpha=.5)

# savefig('../figures/subplot-grid.png', dpi=64)
show()
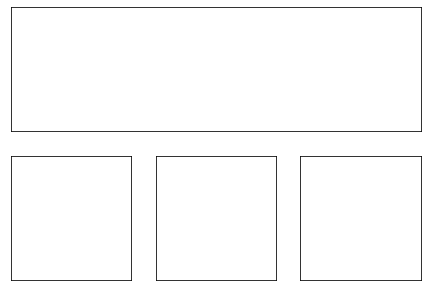
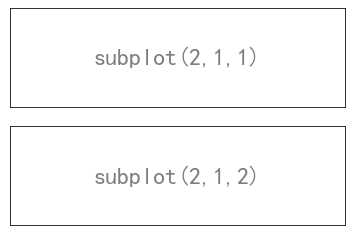
from pylab import *

subplot(2,1,1)
xticks([]), yticks([])
text(0.5,0.5, 'subplot(2,1,1)',ha='center',va='center',size=24,alpha=.5)

subplot(2,1,2)
xticks([]), yticks([])
text(0.5,0.5, 'subplot(2,1,2)',ha='center',va='center',size=24,alpha=.5)

# plt.savefig('../figures/subplot-horizontal.png', dpi=64)
show()
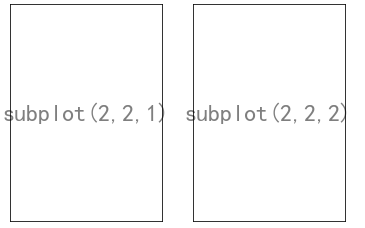
from pylab import *

subplot(1,2,1)
xticks([]), yticks([])
text(0.5,0.5, 'subplot(2,2,1)',ha='center',va='center',size=24,alpha=.5)

subplot(1,2,2)
xticks([]), yticks([])
text(0.5,0.5, 'subplot(2,2,2)',ha='center',va='center',size=24,alpha=.5)

show()
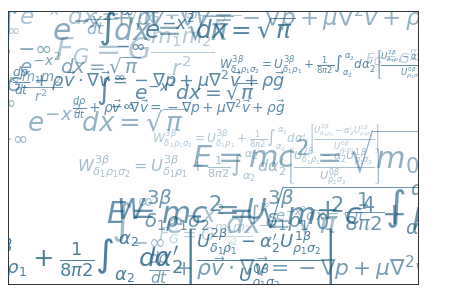
import numpy as np
import matplotlib.pyplot as plt

eqs = []
eqs.append((r"$W^{3\beta}_{\delta_1 \rho_1 \sigma_2} = U^{3\beta}_{\delta_1 \rho_1} + \frac{1}{8 \pi 2} \int^{\alpha_2}_{\alpha_2} d \alpha^\prime_2 \left[\frac{ U^{2\beta}_{\delta_1 \rho_1} - \alpha^\prime_2U^{1\beta}_{\rho_1 \sigma_2} }{U^{0\beta}_{\rho_1 \sigma_2}}\right]$"))
eqs.append((r"$\frac{d\rho}{d t} + \rho \vec{v}\cdot\nabla\vec{v} = -\nabla p + \mu\nabla^2 \vec{v} + \rho \vec{g}$"))
eqs.append((r"$\int_{-\infty}^\infty e^{-x^2}dx=\sqrt{\pi}$"))
eqs.append((r"$E = mc^2 = \sqrt{{m_0}^2c^4 + p^2c^2}$"))
eqs.append((r"$F_G = G\frac{m_1m_2}{r^2}$"))


plt.axes([0.025,0.025,0.95,0.95])

for i in range(24):
    index = np.random.randint(0,len(eqs))
    eq = eqs[index]
    size = np.random.uniform(12,32)
    x,y = np.random.uniform(0,1,2)
    alpha = np.random.uniform(0.25,.75)
    plt.text(x, y, eq, ha='center', va='center', color="#11557c", alpha=alpha,
             transform=plt.gca().transAxes, fontsize=size, clip_on=True)

plt.xticks([]), plt.yticks([])
# savefig('../figures/text_ex.png',dpi=48)
plt.show()
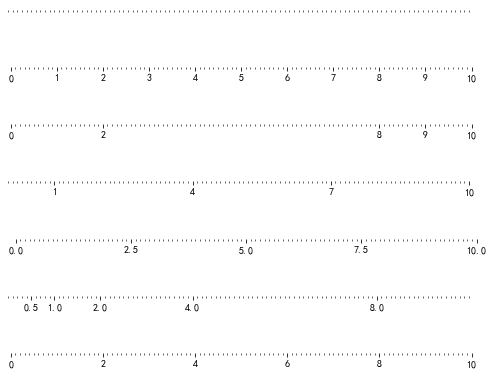
import matplotlib
#matplotlib.use('Agg')
from pylab import *

def tickline():

    size = 512,32
    dpi = 72.0
    figsize= size[0]/float(dpi),size[1]/float(dpi)
    fig = plt.figure(figsize=figsize, dpi=dpi)
    fig.patch.set_alpha(0)

    ax = axes([0.05, 0, 0.9, 1], frameon=False)
    xlim(0,10), ylim(-1,1), yticks([])
    ax = gca()
    ax.spines['right'].set_color('none')
    ax.spines['left'].set_color('none')
    ax.spines['top'].set_color('none')
    ax.xaxis.set_ticks_position('bottom')
    ax.spines['bottom'].set_position(('data',0))
    ax.yaxis.set_ticks_position('none')
    ax.xaxis.set_minor_locator(MultipleLocator(0.1))
    ax.plot(np.arange(11), np.zeros(11), color='none')
    return ax

ax = tickline()
ax.xaxis.set_major_locator(NullLocator())

ax = tickline()
ax.xaxis.set_major_locator(MultipleLocator(1.0))

ax = tickline()
ax.xaxis.set_major_locator(FixedLocator([0,2,8,9,10]))

ax = tickline()
ax.xaxis.set_major_locator(IndexLocator(3,1))

ax = tickline()
ax.xaxis.set_major_locator(LinearLocator(5))

ax = tickline()
ax.xaxis.set_major_locator(LogLocator(2,[1.0]))

ax = tickline()
ax.xaxis.set_major_locator(AutoLocator())