相关博文:
1、Centos7安装Promethus(普罗米修斯)监控系统完整版
2、Promethus(普罗米修斯)监控Mysql数据库
3、Promethus(普罗米修斯)安装Grafana可视化图形工具
4、Promethus的Grafana图形显示MySQL监控数据
5、Promethus(普罗米修斯)的Grafana+onealert实现报警功能
Promethus(普罗米修斯)监控Mysql数据库
这个是基于上面环境搭建的,需要的可以访问方面连接查看。
教程使用的软件:链接: https://pan.baidu.com/s/1QV4KYZksyIp65UsScioq4Q 提取码: vcej
监控远程MySQL
| 服务器 | IP地址 |
| Prometneus服务器 | 192.168.116.129 |
| 被监控服务器(mysql) | 192.168.116.130 |
| grafana服务器 | 192.168.116.131 |
① 在被管理机agent1上安装mysqld_exporter组件
下载地址: https://prometheus.io/download/
上传mysqld_exporter组件

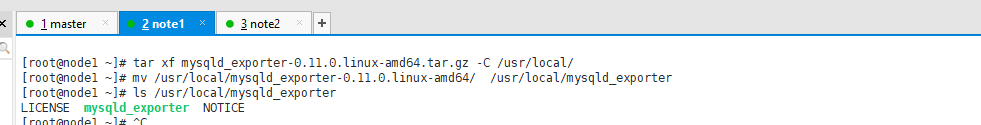
安装mysqld_exporter组件
tar xf mysqld_exporter-0.11.0.linux-amd64.tar.gz -C /usr/local/
mv /usr/local/mysqld_exporter-0.11.0.linux-amd64/  /usr/local/mysqld_exporter
ls /usr/local/mysqld_exporter
安装mariadb数据库,并授权
yum install mariadb\* -y
systemctl restart mariadb
systemctl enable mariadb
mysql
MariaDB [(none)]> grant select,replication client,process ON *.* to 'mysql_monitor'@'localhost' identified by '123'; (注意:授权ip为localhost,因为不是prometheus服务器来直接找mariadb 获取数据,而是prometheus服务器找mysql_exporter,mysql_exporter 再找mariadb。所以这个localhost是指的mysql_exporter的IP)
MariaDB [(none)]> flush privileges;
MariaDB [(none)]> quit

创建一个mariadb配置文件,写上连接的用户名与密码(和上面的授权的用户名 和密码要对应)
vim /usr/local/mysqld_exporter/.my.cnf [client]
user=mysql_monitor
password=123
启动mysqld_exporter
nohup /usr/local/mysqld_exporter/mysqld_exporter --config.my-cnf=/usr/local/mysqld_exporter/.my.cnf &确认端口(9104)

② 回到prometheus服务器的配置文件里添加被监控的mariadb的配置段
在主配置文件最后再加上下面三行
vim /usr/local/prometheus/prometheus.yml - job_name: 'mariadb'
static_configs:
- targets: ['192.168.116.130:9104']

- job_name: 'agent1_mariadb'  # 取一个job 名称来代表被监控的mariadb
  static_configs:
  - targets: ['10.1.1.14:9104']     # 这里改成 被监控机器的IP,后面端口接9104
改完配置文件后,重启服务
pkill prometheus /usr/local/prometheus/prometheus --config.file="/usr/local/prometheus/prometheus.yml" &③ 回到web管理界面 --》点Status --》点Targets --》可以看到监控 mariadb了


