什么是Prometheus?
Prometheus(普罗米修斯)是由SoundCloud开发的开源监控报警系统和时序列数据库(TSDB)。Prometheus使用Go语言开发,是Google BorgMon监控系统的开源版本。
2012年成为社区开源项目,拥有非常活跃的开发人员和用户社区。
2016年由Google发起Linux基金会旗下的原生云基金会(Cloud Native Computing Foundation), 将Prometheus纳入其下第二大开源项目。
Prometheus目前在开源社区相当活跃。
Prometheus和Heapster(Heapster是K8S的一个子项目,用于获取集群的性能数据。)相比功能更完善、更全面。Prometheus性能也足够支撑上万台规模的集群。
Prometheus的特点
多维度数据模型。
灵活的查询语言。
不依赖分布式存储,单个服务器节点是自主的。
通过基于HTTP的pull方式采集时序数据。
可以通过中间网关进行时序列数据推送。
通过服务发现或者静态配置来发现目标服务对象。
支持多种多样的图表和界面展示,比如Grafana等。
普罗米修斯原理架构图

基础环境
centos7.5 192.168.122.184
关闭防火墙和selinux
[root@localhost ~]# systemctl stop firewalld && systemctl  disable firewalld
[root@localhost ~]# sed -i 's/SELINUX=enforcing/SELINUX=disabled/g' /etc/selinux/config
[root@localhost ~]# getenforce
Permissive
Prometheus 安装
官网地址:https://prometheus.io
wget https://github.com/prometheus/prometheus/releases/download/v2.17.1/prometheus-2.17.1.linux-amd64.tar.gz
解压安装包
[root@localhost ~]# tar zxf prometheus-2.17.1.linux-amd64.tar.gz
[root@localhost ~]# mv prometheus-2.17.1.linux-amd64  /usr/local/prometheus
启动服务
[root@localhost ~]# cd /usr/local/Prometheus
[root@localhost ~]# /usr/local/prometheus/prometheus --config.file="/usr/local/prometheus/prometheus.yml" &
访问
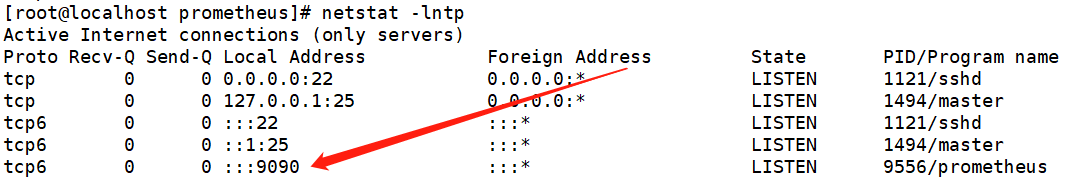

默认只监控本机一台机器
