前言:可视化图表页面需要提供保存图片的功能,图表使用了g2,但是g2的原生样式并不能满足需求的高度定制化,于是使用了g2的自定义样式,用DOM重写了图表样式,但是再使用g2的生成图片方法,DOM部分无法生成图片,这时就需要使用html2canvas将DOM生成图片。
一、引入g2和html2canvas(本文以饼图为例,g2的用法自行查看文档)
import html2canvas from 'html2canvas';
import G2 from '@antv/g2';
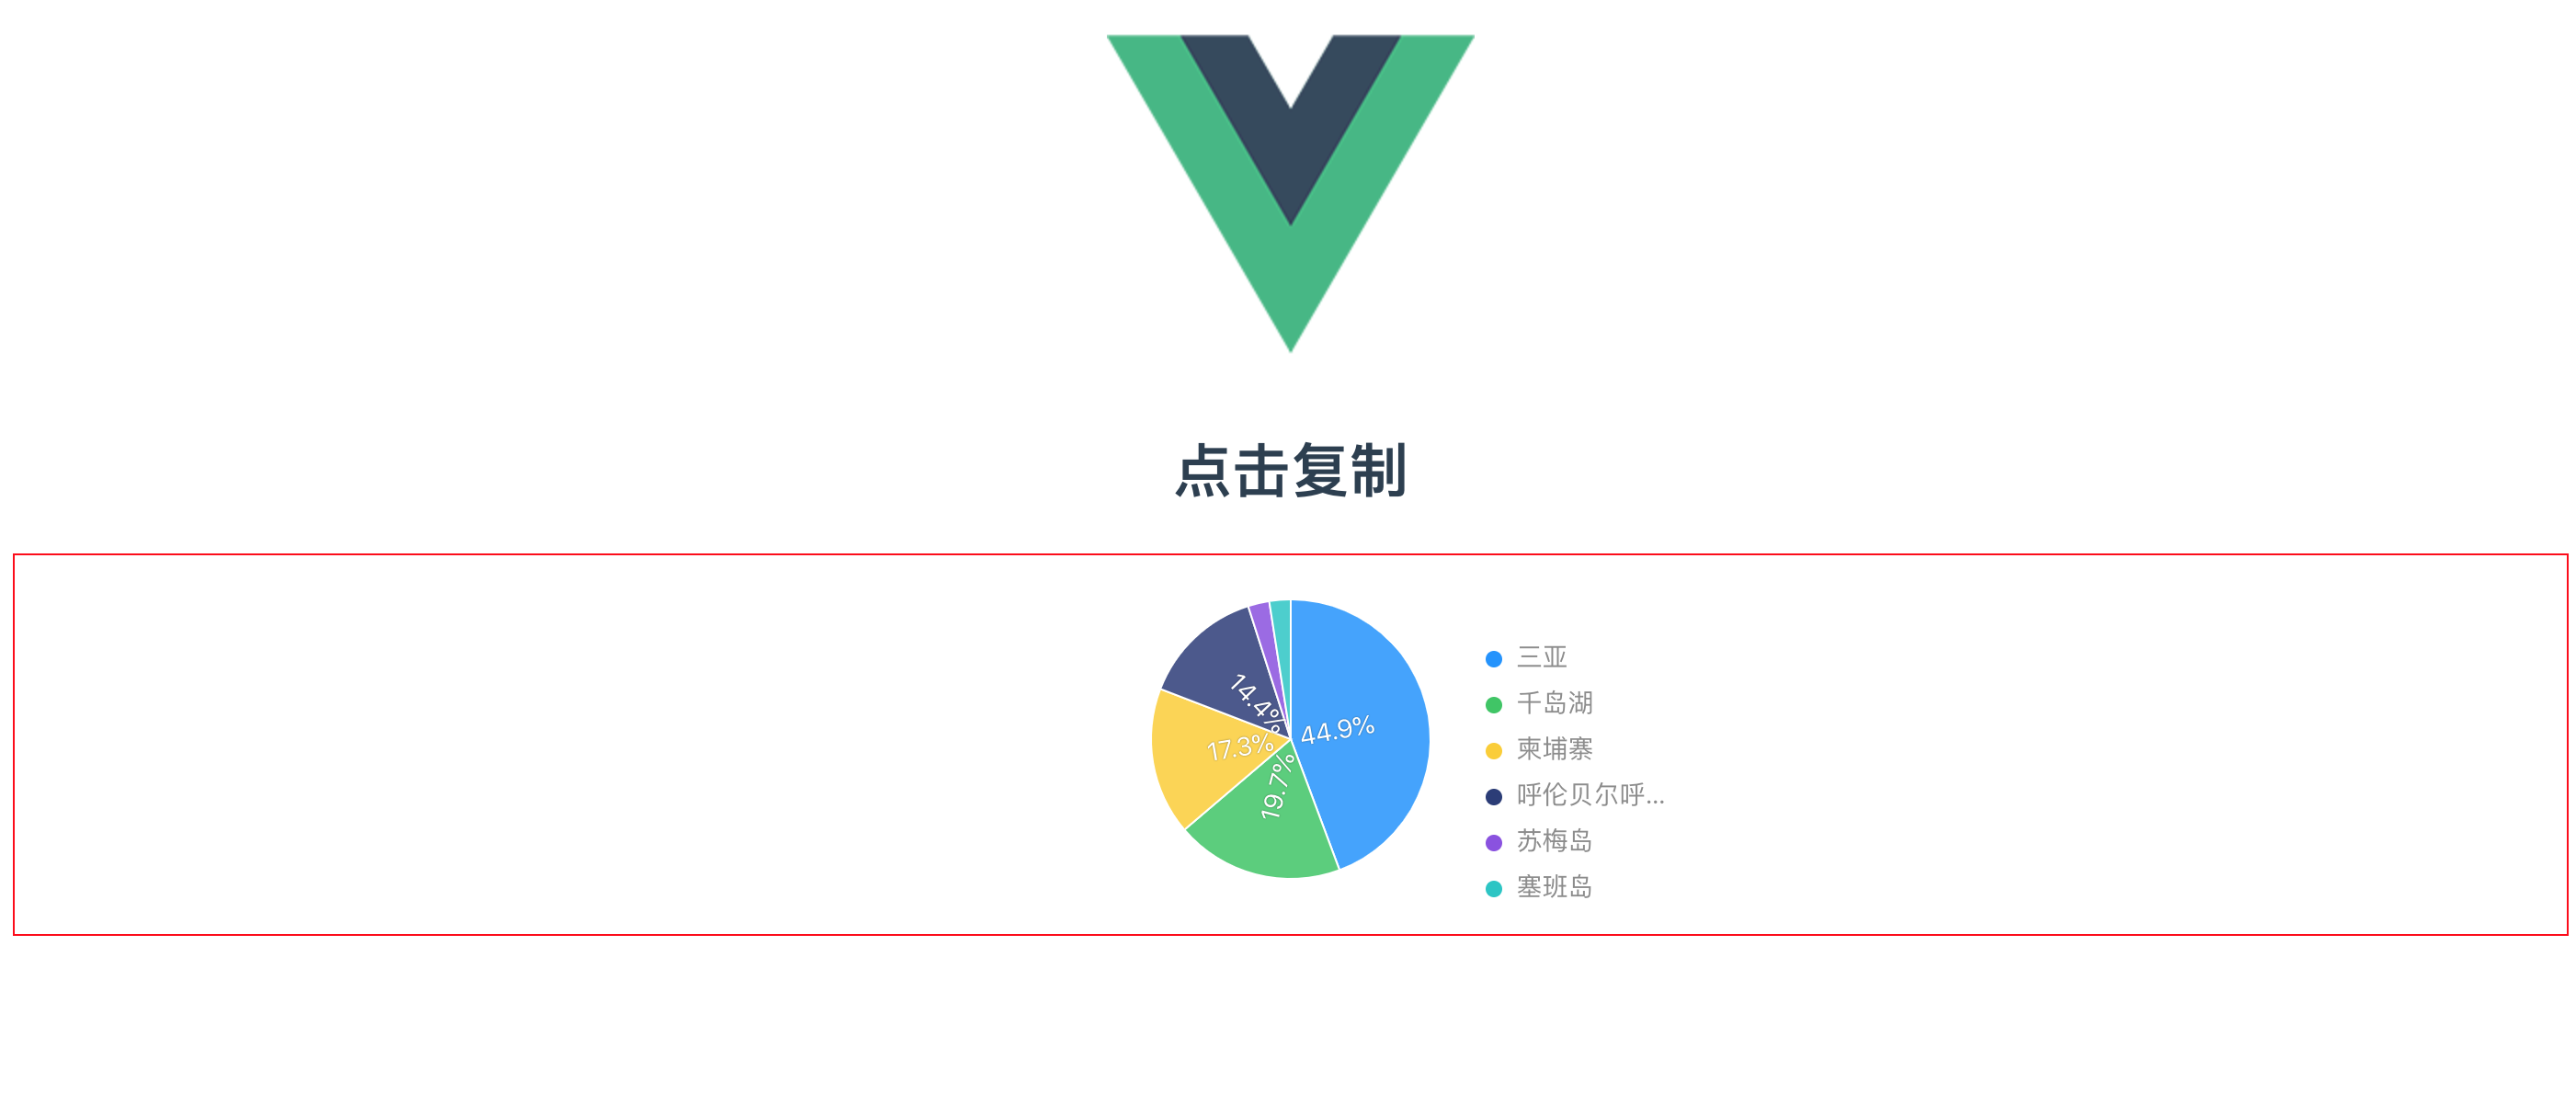
先上图:
g2绘制方法:
draw() {
      const data = [
      { location: '三亚', value: 44.9 },
      { location: '千岛湖', value: 19.7 },
      { location: '柬埔寨', value: 17.3 },
      { location: '呼伦贝尔呼伦贝尔呼伦贝尔呼伦贝尔', value: 14.4 },
      { location: '苏梅岛', value: 2.5 },
      { location: '塞班岛', value: 2.5 }
      ];
      const chart = new G2.Chart({
      container: 'c1',
      width:800,
      height: 200,
      padding: 'auto'
      });
      chart.source(data);
      chart.legend({
        useHtml: true,
        position:'right',
        containerTpl: '<div class="g2-legend">' +
          '<div class="g2-legend-list" style="list-style-type:none;margin:0;padding:0;"></div>' +
          '</div>',
        itemTpl: (value, color, checked, index) => {
          checked = checked ? 'checked' : 'unChecked';
          return `<div class="g2-legend-list-item item-${index} ${checked}" data-value=${value} data-color=${color}
            style="cursor: pointer;font-size: 14px;width:100px;overflow:hidden;text-overflow: ellipsis;white-space: nowrap;">
            <span width=150 style="border: none;padding:0;"><i class="g2-legend-marker" style="width:10px;height:10px;display:inline-block;margin-right:10px;background-color:${color};"></i></span>
            ${value}
            </div>`;
        },
      });
      chart.coord('theta', {
      radius: 0.8
      });
      chart.intervalStack().position('value').color('location', [ '#1890ff', '#37c661', '#fbce1e', '#2b3b79', '#8a4be2', '#1dc5c5' ])
      .style({
        stroke: 'white',
        lineWidth: 1
      })
      .label('value', val => {
        if (val < 3) {
          return null;
        }
        return {
          offset: -30,
          textStyle: {
            fill: 'white',
            fontSize: 14,
            shadowBlur: 2,
            shadowColor: 'rgba(0, 0, 0, .45)'
          },
          formatter: text => {
            return text + '%';
          }
        };
      });
      chart.render();
    }
legend部分useHtml配置为true,页面使用DOM的方式渲染右边的图例,因为是DOM,所以我们可以通过样式设置文字超出显示省略号,红色的框是为了更清楚标出截图范围。
二、截图方法
capture() {
      const rect = document.querySelector('#c1').getBoundingClientRect();
      let scrollTop = document.documentElement.scrollTop || document.body.scrollTop// 获取滚动轴滚动的长度
      console.log(document.querySelector('#c1').getBoundingClientRect());  //eslint-disable-line
      html2canvas(document.querySelector('#c1'),{
        width:rect.width,
        height:rect.height,
        scrollY: -scrollTop,  // 页面存在滚动时,需要设置此属性,解决绘图偏移问题
      }).then(function(canvas) {
          console.log(canvas.toDataURL());  // eslint-disable-line
          document.body.appendChild(canvas);
      });
    },
rect:可以获取到Dom宽高位置等属性;
#c1:为截图的容器,图表写在容器里面;
html2canvas方法第一个参数传容器Dom,第二个参数传配置参数;
then回调可以获取到截图生成的canvas,然后再使用canvas生成图片的方法,便得到了我们要的图片。
(为了效果明显,我将生成的canvas添加到页面上)
其中scrollY参数很重要,不写的效果如下:
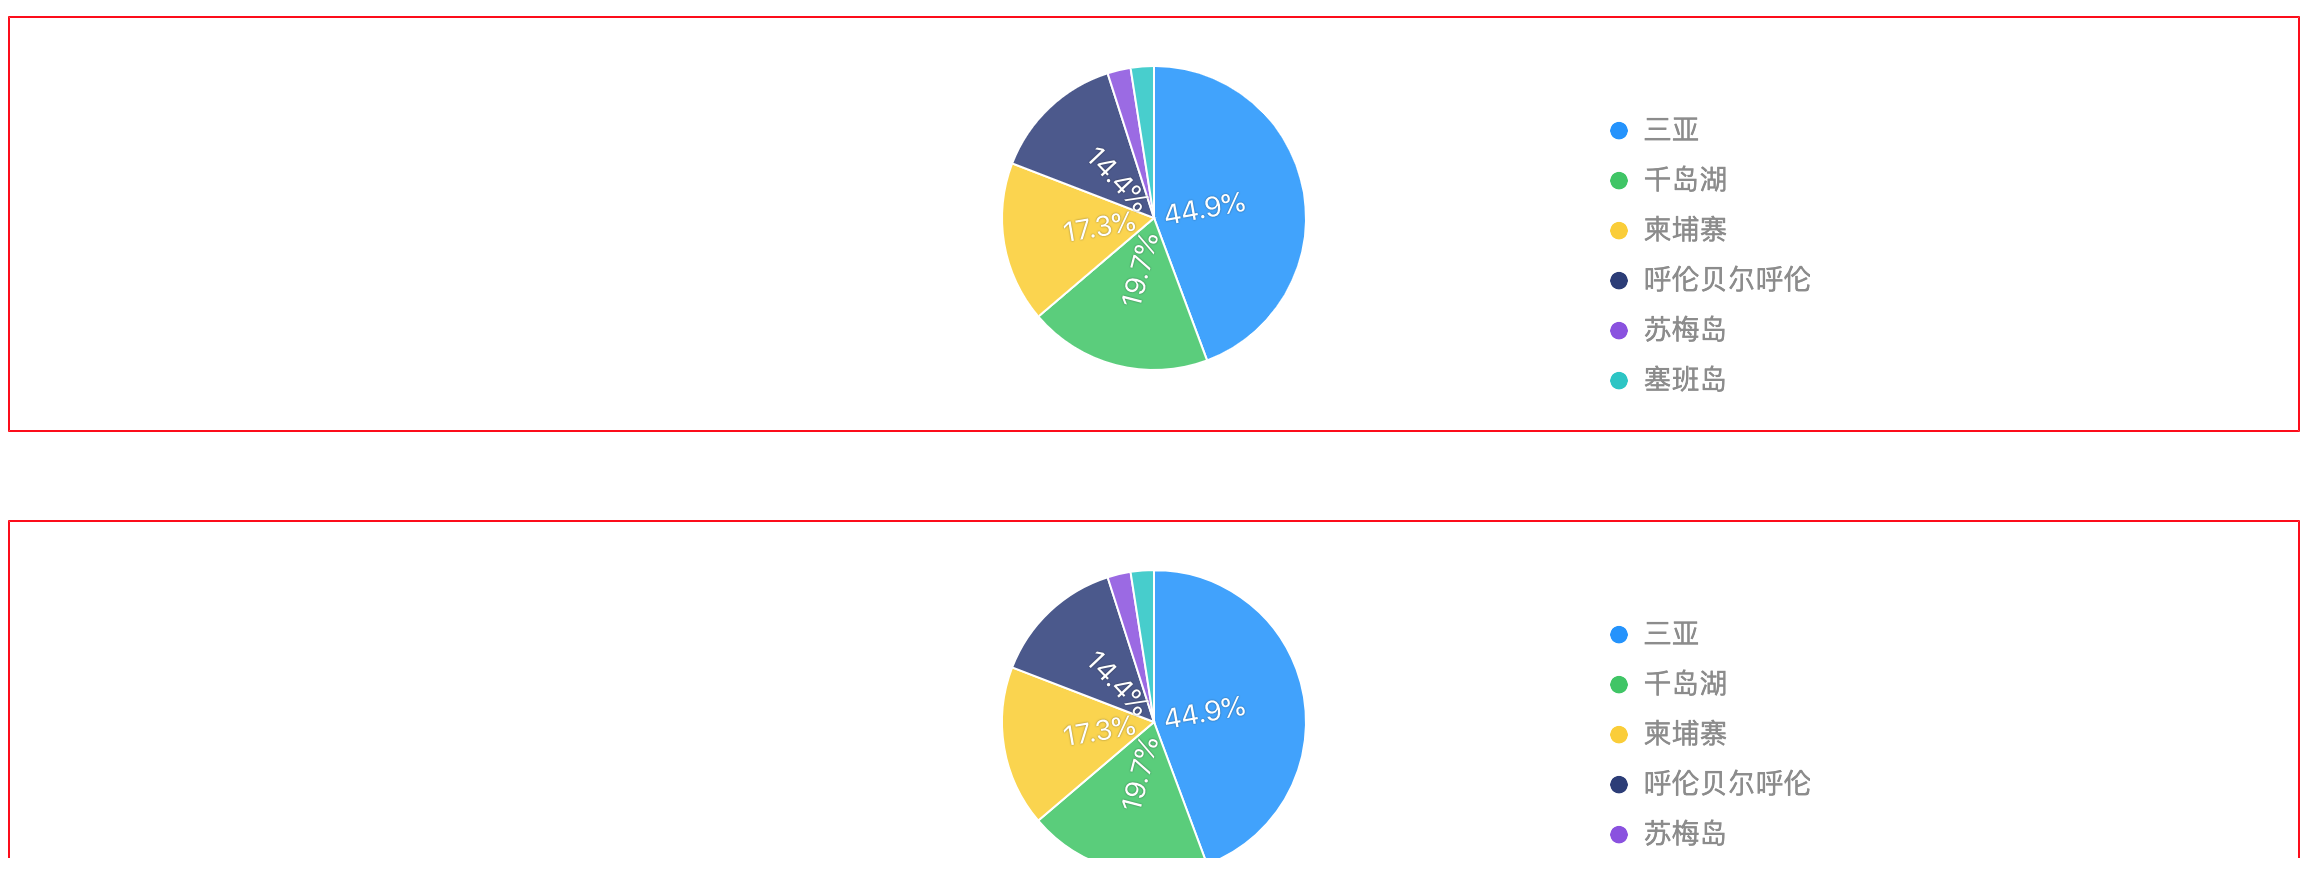
当页面有滚动行为时,会发现生成的canvas相对于原图发生了偏移,饼图底部被切了一块,顶部多了一块空白。
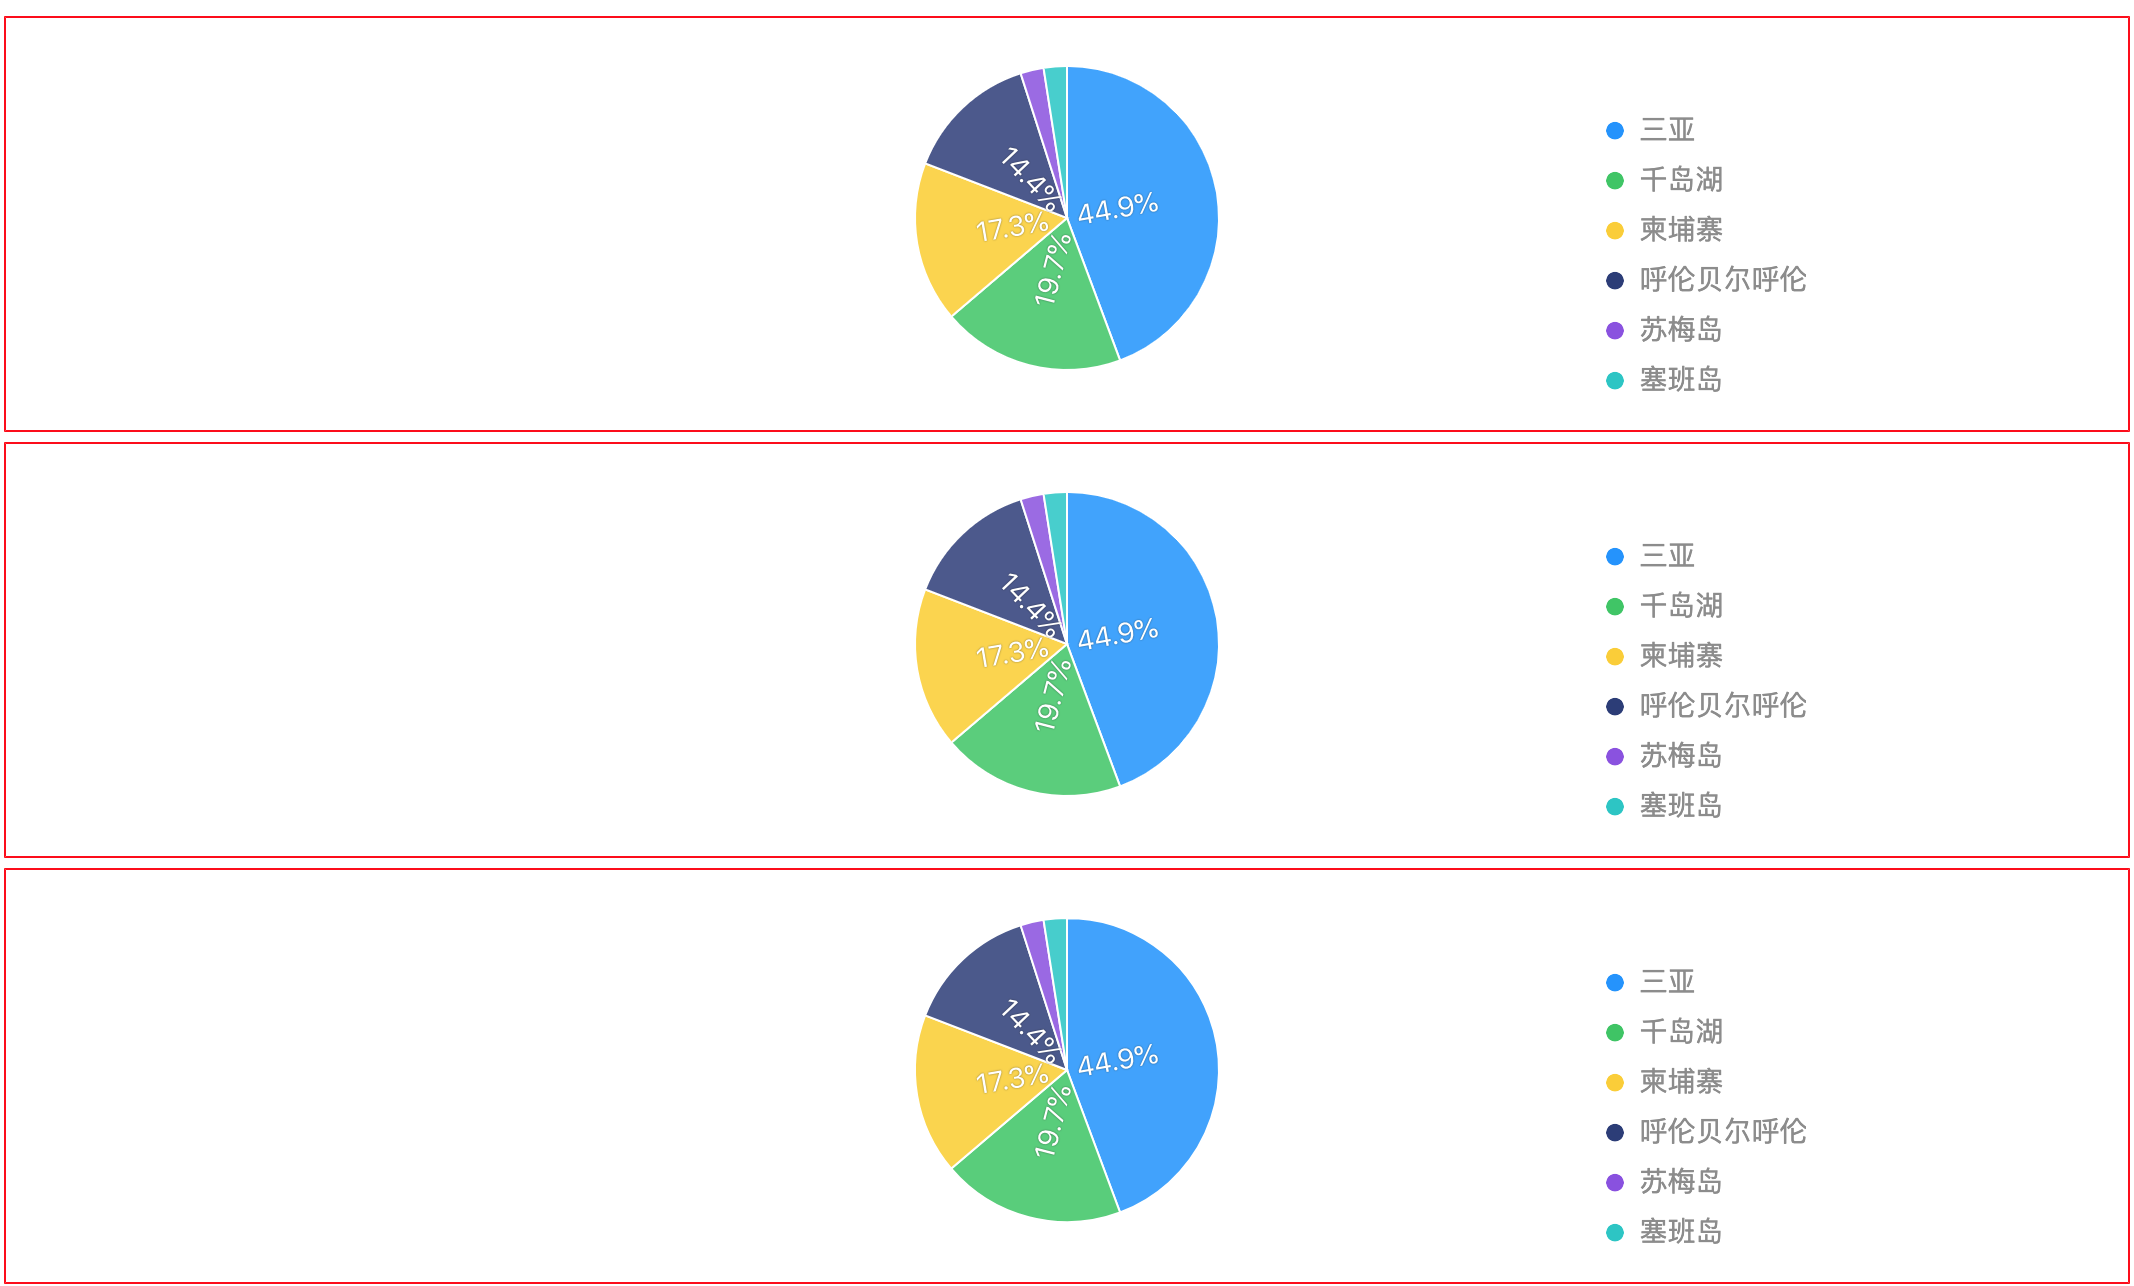
scrollY对应了页面滚动高度,设置好之后的效果:
最后:html2canvas将dom的效果以canvs的形式画出来,确实很强大,在我们愉快玩耍的时候,也需要注意它的一些不兼容问题,比如图中的省略号的效果无法显示的问题,还有部分css3的特殊属性也需要注意。