gdb
gdb是Linux下的调试工具,如果需要调试,则要在编译时加上-g选项,否则无法调试。
gdb常用指令:
- gcc/g++ -g test.c/test.cpp ———-调试前先对源文件进行编译,注意一定要加 -g。
- gdb a.out ——— a.out为可已经编译好的可执行文件(当然如果存在语法错误是肯定不能进入gdb调试的)。
- list/l 行号 ——- 显示源代码,从指定行号处开始显示,每次显示10行。
- list/l 函数名 ——- 列出某个函数的源代码。
- run/r ——- 运行程序。
- next/n ——-单条执行,类似于Vs中的F10。
- step/s ——-进入函数调用,类似于Vs中的F11。
- break/b 行号 ——- 在某一行设置断点。
- break/b 函数 ——- 在某个函数处设置断点。
- info break/b ——–查看断点信息。
- finish ——- 执行到当前函数返回,然后停下来等待命令。
- print/p ——打印表达式的值,通过表达式的值可以修改变量的值或者调用函数。
- p 变量 ——- 打印变量的值。
- continue/c ——-从当前位置开始连续而非单步执行程序。
- delete breakpoints ——- 删除所有断点。
- delete breakpoints n —– 删除序号为n的断点。
- disable breakpoints ——- 禁用断点。
- enable breakpoints —– 启用断点。
- info/i breakpoints ——查看当前设置了哪些断点。
- display 变量名 —– 跟踪查看一个变量,每次停下来都显示它的值。
- undisplay —-取消对先前设置的那些变量的跟踪。
- until X行号 —– 跳至X行。
- breaktrace/bt —-查看各级函数调用及参数。
- info/i locals ——- 查看当前栈帧局部变量的值。
- quit/q ——- 退出gdb。
gdb调试多进程
默认设置下,在调试多进程程序时GDB只会调试主进程。但是GDB(>V7.0)支持多进程的分别以及同时调试,换句话说,GDB可以同时调试多个程序。只需要设置follow-fork-mode(默认值:parent)和detach-on-fork(默认值:on)即可。
| follow-fork-mode |
detach-on-fork |
说明 |
| parent |
on |
只调试主进程(GDB默认) |
| child |
on |
只调试子进程 |
| parent |
off |
同时调试两个进程,gdb跟主进程,子进程block在fork位置 |
| child |
off |
同时调试两个进程,gdb跟子进程,主进程block在fork位置 |
设置方法:set follow-fork-mode [parent|child] set detach-on-fork [on|off]
- 查询正在调试的进程:info inferiors
- 切换调试的进程: inferior <infer number>
- 添加新的调试进程: add-inferior [-copies n] [-exec executable] ,可以用file executable来分配给inferior 可执行文件。
- 其他:remove-inferiors infno, detach inferior
我们先写一个多进程代码以供测试使用:
#include <stdio.h>
#include <sys/types.h>
#include <unistd.h>
#include <sys/wait.h>

int main()

{
	pid_t id = fork();
	if(id < 0)
	{
		printf("fork error!\n");
		return 1;
	}
	else if(id == 0)
	{
		//child
		printf("I am child!,my pid is %d,my father is %d\n",getpid(),getppid());
	}
	else
	{
		//father
		printf("I am father,my pid is %d\n",getpid());
		wait(NULL);
	}
	return 0;
}
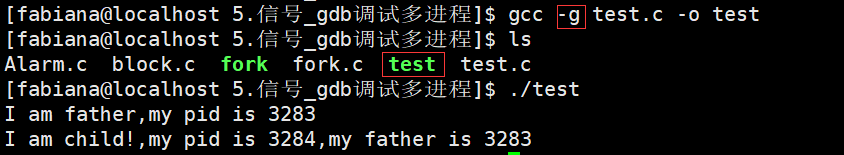
编译时切记要加-g选项
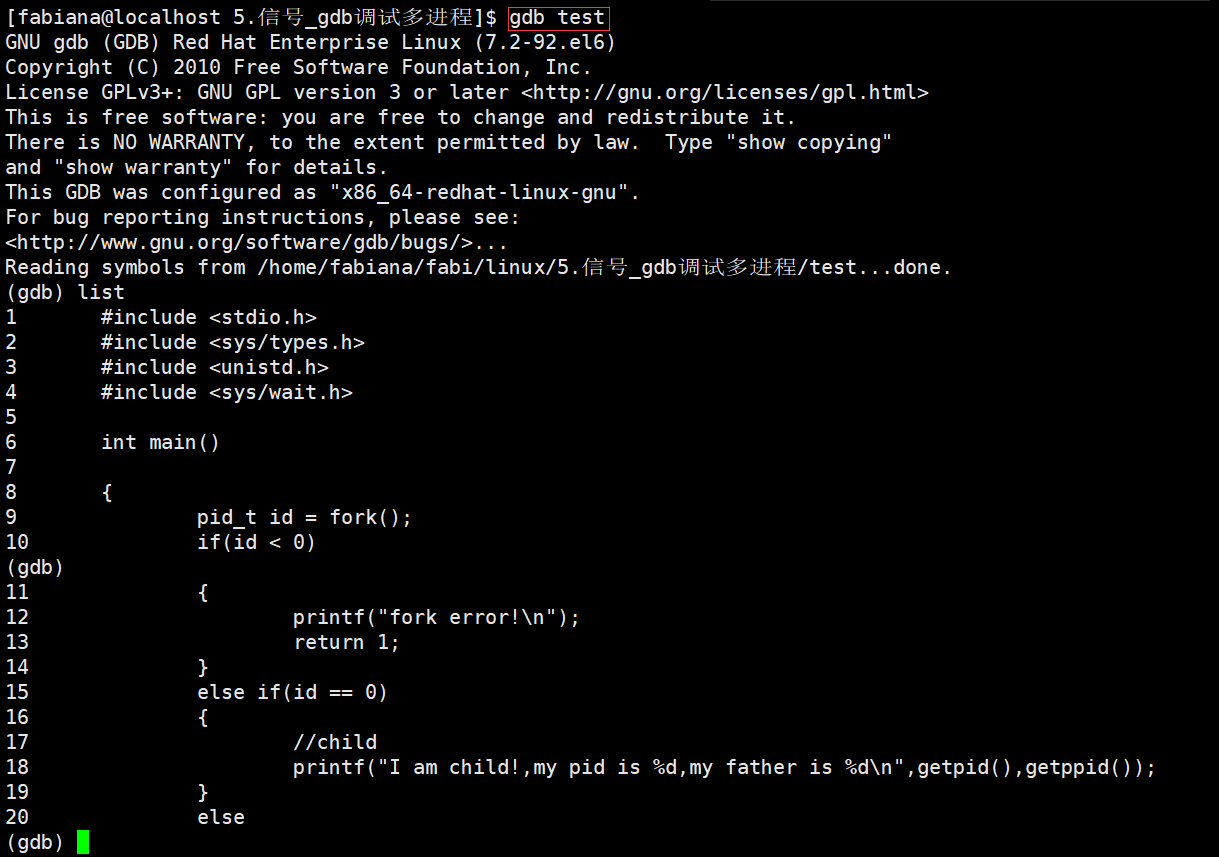
输入gdb test进入调试,输入list列出代码,回车显示更多行代码。
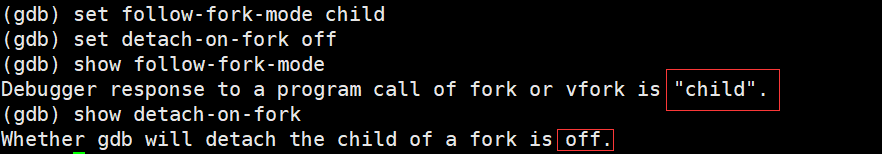
用show指令查看follow-fork-mode [parent|child] detach-on-fork [on|off]当前选项状态
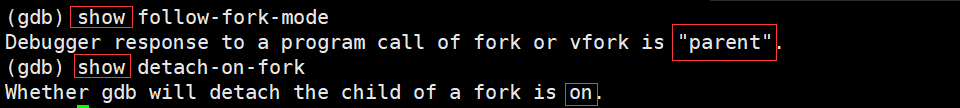
接下来我们利用set将follow-fork-mode与detach-on-fork的选项分别设置为child与o
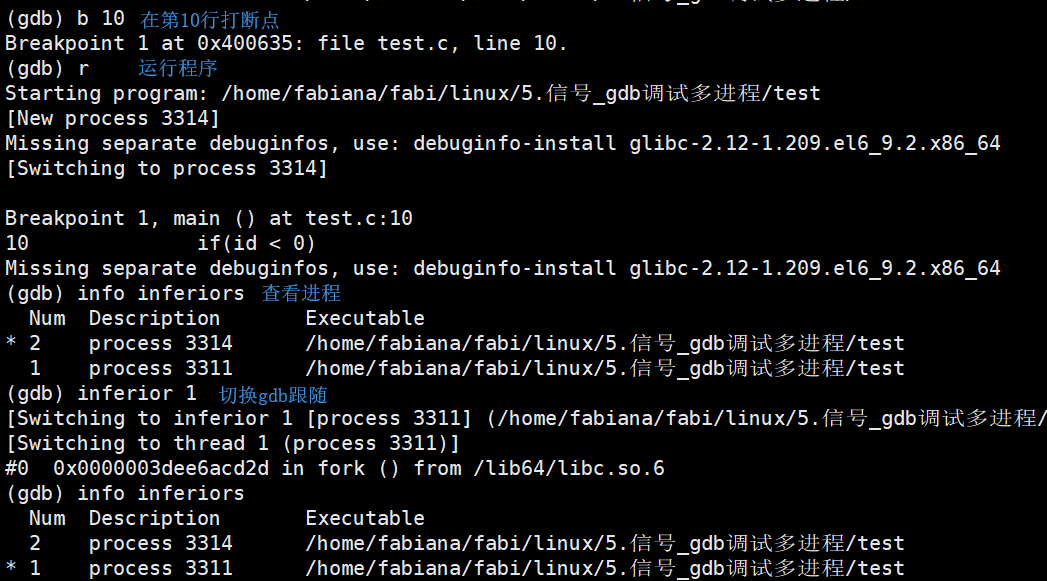
我们可以在上面list之后的图中看到在第10行fork()完毕,我们在第10行打个断点break(b),然后run(r)运行。
随后输入info inferiors查看程序中的多进程,gdb会默认赋予其编号,可以看见在2之前有一个*,这表示gdb跟随此进程。我们可以利用inferiors+编号,来切换要调试的进程。