先看看mongodbmongos.log中提示的异常信息:
2019-05-21T18:49:34.355+0800 I COMMAND  [conn174701] command detail_links.lvdun_links command: insert { insert: "lvdun_links", ordered: true, lsid: { id: UUID("db1b9d8a-60e7-485c-9c01-b70f78e023f5") }, $clusterTime: { clusterTime: Timestamp(1558435753, 12), signature: { hash: BinData(0, 0000000000000000000000000000000000000000), keyId: 0 } }, $db: "detail_links", $readPreference: { mode: "primary" } } nShards:1 ninserted:0 numYields:0 reslen:353 protocol:op_msg 19568ms
2019-05-21T18:49:34.402+0800 W NETWORK  [conn175804] Unable to reach primary for set shard2
2019-05-21T18:49:34.726+0800 W NETWORK  [thread101564] Unable to reach primary for set shard3
2019-05-21T18:49:34.904+0800 W NETWORK  [conn175804] Unable to reach primary for set shard2
2019-05-21T18:49:35.152+0800 W NETWORK  [ReplicaSetMonitor-TaskExecutor] Unable to reach primary for set shard2
2019-05-21T18:49:35.227+0800 W NETWORK  [thread101564] Unable to reach primary for set shard3
2019-05-21T18:49:35.406+0800 W NETWORK  [conn175804] Unable to reach primary for set shard2
2019-05-21T18:49:35.729+0800 W NETWORK  [thread101564] Unable to reach primary for set shard3
2019-05-21T18:49:35.908+0800 W NETWORK  [conn175804] Unable to reach primary for set shard2
2019-05-21T18:49:36.232+0800 W NETWORK  [thread101564] Unable to reach primary for set shard3
2019-05-21T18:49:36.410+0800 W NETWORK  [conn175804] Unable to reach primary for set shard2
2019-05-21T18:49:36.734+0800 W NETWORK  [thread101564] Unable to reach primary for set shard3
2019-05-21T18:49:36.734+0800 I NETWORK  [thread101564] Cannot reach any nodes for set shard3. Please check network connectivity and the status of the set. This has happened for 1280971 checks in a row.
2019-05-21T18:49:36.912+0800 W NETWORK  [conn175804] Unable to reach primary for set shard2
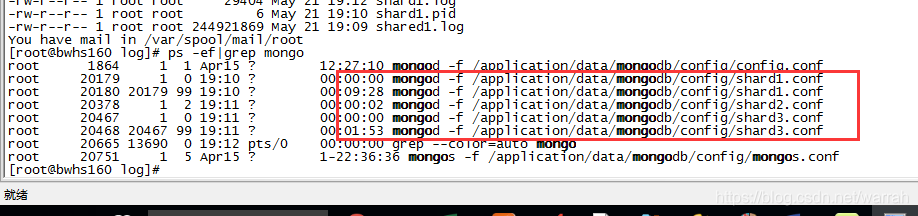
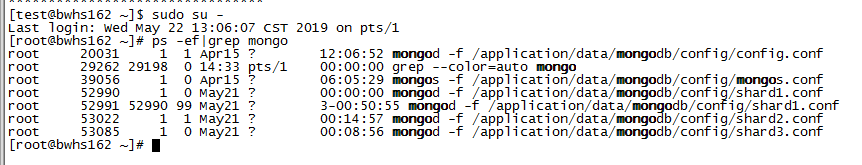
执行ps -ef|grep mongo,shard1和shard2的分片挂了。
root      1864     1  1 Apr15 ?        12:26:47 mongod -f /application/data/mongodb/config/config.conf
root      5649     1  0 Apr15 ?        05:20:11 mongod -f /application/data/mongodb/config/shard2.conf
root     15709     1 29 18:45 ?        00:01:52 mongod -f shard1.conf
root     16979 15932  0 18:52 pts/1    00:00:00 grep --color=auto mongo
root     20751     1  5 Apr15 ?        1-22:36:07 mongos -f /application/data/mongodb/config/mongos.conf
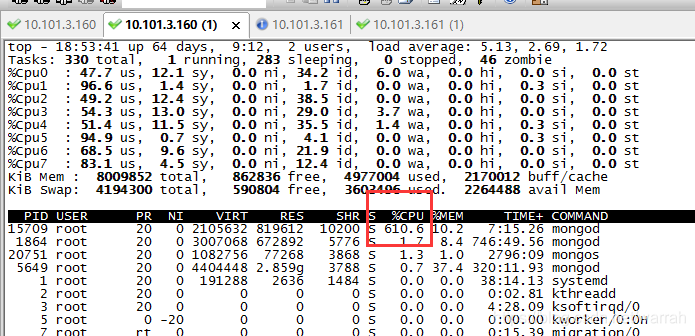
执行top命令,发现mongo消耗大量cpu。
那么mongodb的分片宕机了,该如何重启呢?
我想到了删掉进程ps -ef | grep shard | grep -v grep | awk '{print $2}' | xargs kill -9
接着执行启动分片命令
 mongod -f /application/data/mongodb/config/shard1.conf
 mongod -f /application/data/mongodb/config/shard2.conf
 mongod -f /application/data/mongodb/config/shard3.conf
从面可以看到居然有多个相同名字的进程
再过了两分钟看进程,居然正常了。同样的命令,再到集群中的其他节点执行,却发生异常
2019-05-21T19:19:46.965+0800 I ROLLBACK [rsBackgroundSync] transition to SECONDARY
2019-05-21T19:19:46.966+0800 I REPL     [rsBackgroundSync] transition to SECONDARY from ROLLBACK
2019-05-21T19:19:46.966+0800 I REPL     [rsBackgroundSync] Resetting sync source to empty, which was bwhs162:27002
2019-05-21T19:19:46.966+0800 F REPL     [rsBackgroundSync] Rollback failed with unrecoverable error: UnrecoverableRollbackError: not willing to roll back more than 86400 seconds of data. Have: 1287753 seconds.
2019-05-21T19:19:46.966+0800 F -        [rsBackgroundSync] Fatal assertion 50666 UnrecoverableRollbackError: not willing to roll back more than 86400 seconds of data. Have: 1287753 seconds. at src/mongo/db/repl/bgsync.cpp 705
2019-05-21T19:19:46.966+0800 F -        [rsBackgroundSync]

***aborting after fassert() failure
在Fatal assertion 50666 UnrecoverableRollbackError中尝试解决方案,可以通过调整rollbackTimeLimitSecs,那么该如何调整呢?
于是尝试执行命令,将分片的启动添加一个参数。再次启动
 mongod -f /application/data/mongodb/config/shard2.conf --setParameter rollbackTimeLimitSecs=1728000
 mongod -f /application/data/mongodb/config/shard3.conf --setParameter rollbackTimeLimitSecs=1728000
shard3提示的异常信息为
2019-05-22T13:09:19.721+0800 F REPL     [rsBackgroundSync] Rollback failed with unrecoverable error: UnrecoverableRollbackError: not willing to roll back more than 1728000 seconds of data. Have: 2266635 seconds.
2019-05-22T13:09:20.786+0800 F -        [rsBackgroundSync] Fatal assertion 50666 UnrecoverableRollbackError: not willing to roll back more than 1728000 seconds of data. Have: 2266635 seconds. at src/mongo/db/repl/bgsync.cpp 705
于是我又调整一下mongod -f /application/data/mongodb/config/shard3.conf --setParameter rollbackTimeLimitSecs=2366635,注意因为mongo最长设置是69年,所以2366635比异常中时间大一截就可以了,这个时候再启动,跟踪日志,看到的是
2019-05-22T13:48:32.209+0800 I REPL     [replexec-12] Canceling priority takeover callback
2019-05-22T13:48:32.209+0800 I REPL     [replexec-12] Not starting an election for a priority takeover, since we are not electable due to: Not standing for election because member is not currently a secondary; member is not caught up enough to the most up-to-date member to call for priority takeover - must be within 2 seconds (mask 0x408)
2019-05-22T13:48:33.319+0800 I REPL     [replexec-12] Scheduling priority takeover at 2019-05-22T13:48:44.195+0800
搜索问题,发现Primary switches to Secondary because a new term has begun里面的bug说明跟我的异常信息是一样的。
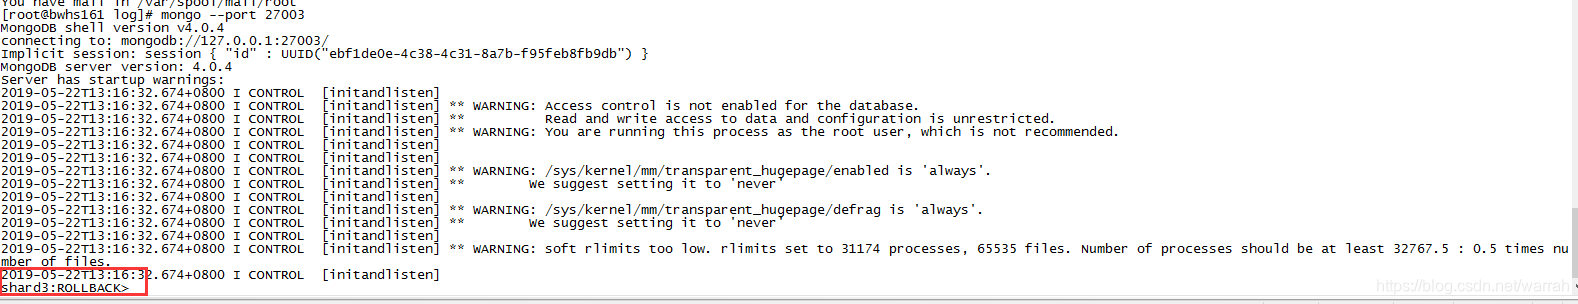
在分片有问题的机器161上面继续分析
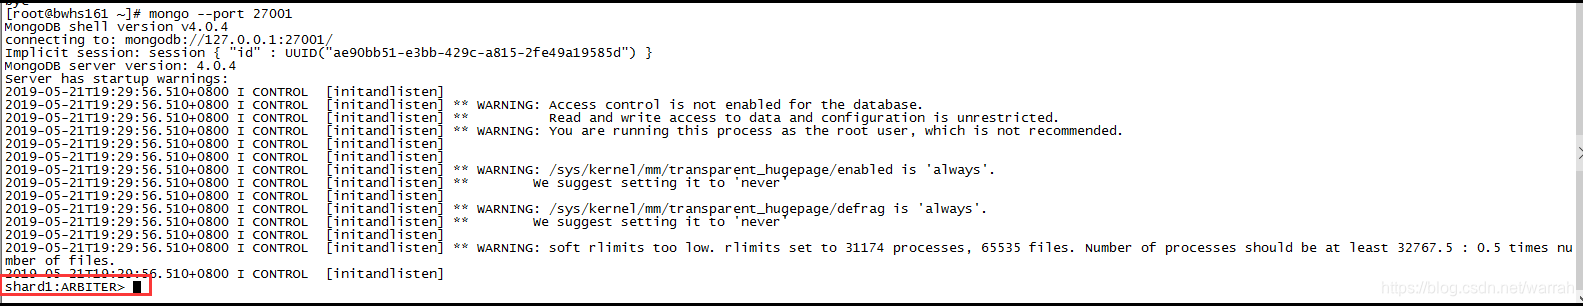
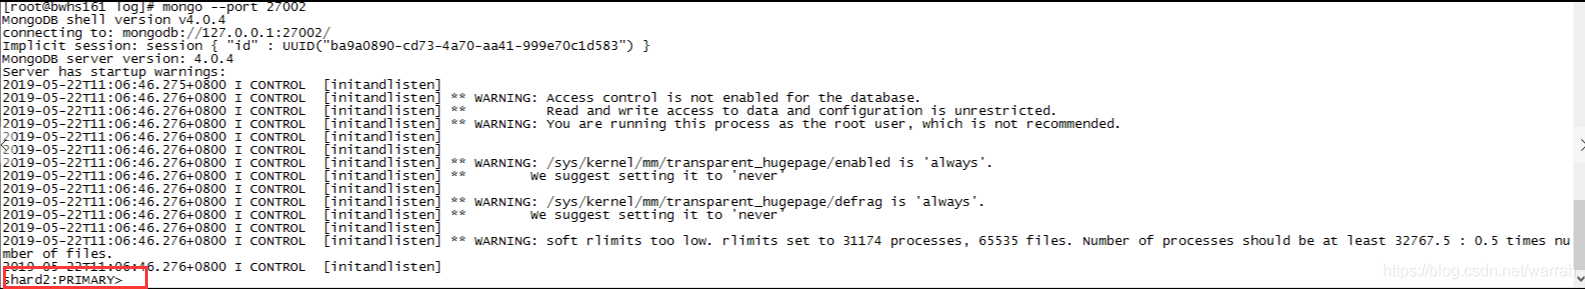
执行命令mongo --port 27001,mongo --port 27002,mongo --port 27003,这里面出现三个不同分片shard1:ARBITER、shard2:PRIMARY、shard3:ROLLBACK,接下就要搞清楚这三者之间是什么关系。
参考mongodb副本集中说明,mongo成员角色分为primary、对客户端可见、参与投票、延迟同步、复制数据,ARBITER是参与投票,那么rollback是什么呢?而我们出问题恰恰是rollback。文章作者这么解释
Rollbacks操作发生在primary处理写操作,但其它成员没有成功的进行复制之前primary掉线时。当先前的primary开始复制 时,则表现出rollback。如果操作复制到其它成员,该成员可用,并且可以和大多数的副本集连接,则没有rollback。

Rollbacks删除了那些没有进行复制的操作,以保证数据集的一致性
那么也就是说上一个primay开始复制时,表现出rollback,如果出现shard3:ROLLBACK说明这个副本正在复制,还没复制完。那么我是不是应该等待他结束呢,或者问题是他什么时候结束呢?
继续等,他好像不会结束的,因为Not standing for election because member is not currently a secondary,这个异常在shard3.log中一直在报错。
为了对比,我再翻开shard1.log,你会发现他也在一直报错,只不过错误信息有所不同.
这个异常说明的问题,倒是很明显,也就是说另外一台机器162的shard1分片挂了。
2019-05-22T14:32:53.018+0800 I ASIO     [Replication] Connecting to bwhs162:27001
2019-05-22T14:32:53.020+0800 I ASIO     [Replication] Failed to connect to bwhs162:27001 - HostUnreachable: Error connecting to bwhs162:27001 (10.101.3.162:27001) :: caused by :: Connection refused
2019-05-22T14:32:53.020+0800 I ASIO     [Replication] Dropping all pooled connections to bwhs162:27001 due to HostUnreachable: Error connecting to bwhs162:27001 (10.101.3.162:27001) :: caused by :: Connection refused
查看162上面的进程,居然有两个shard1进程.那是不是把这个shard1进程删掉,重启就可以了呢?试试再说。
重启之后,再观察162的日志,发现晕掉,有一个没有见过的异常,这个时候又需要耐心的去寻求答案,或许这些问题之间有什么关联。serverStatus was very slow又是怎么回事呢,字面上的意思是服务器状态非常慢,于是继续上网查。
2019-05-22T15:06:42.629+0800 I COMMAND [ftdc] serverStatus was very slow: { after basic: 0, after asserts: 0, after backgroundFlushing: 0, after connections: 0, after dur: 0, after extra_info: 0, after globalLock: 0, after locks: 0, after logicalSessionRecordCache: 0, after network: 1418, after opLatencies: 1418, after opcounters: 1418, after opcountersRepl: 1418, after repl: 1418, after shardingStatistics: 1418, after storageEngine: 1418, after tcmalloc: 1418, after transactions: 1418, after wiredTiger: 1418, at end: 1418 }
MongoDb 中 serverStatus was very slow 的原因分析,这篇文章说可以通过mongostat查看fault状态的进程,但是实际操作,却又报错,估计很多人对此都失去信心呢,这个时候唯一能做的就是抽丝剥茧,咬牙坚持下去
[root@bwhs162 bin]# mongostat
2019-05-22T15:22:35.148+0800    Failed: error connecting to db server: no reachable servers
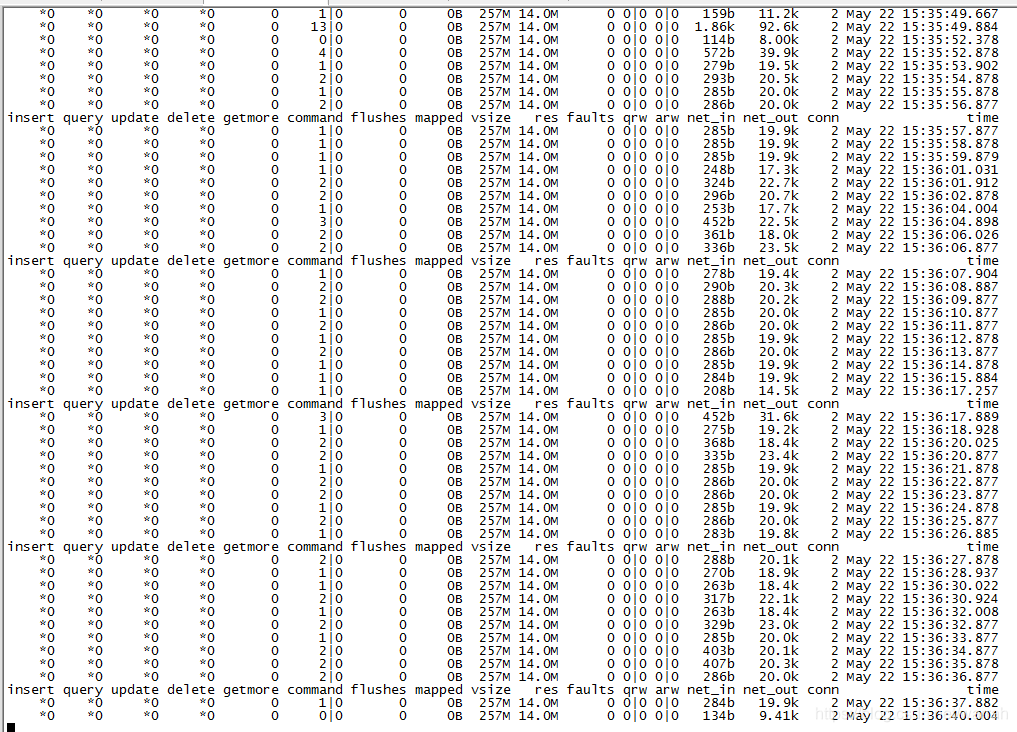
那么怎么正确的执行mongostat命令呢,查看mongostat详解 mongodb性能监控工具,执行命令mongostat -h 10.101.3.162:20000后的结果如下,注意端口是mongos进程的端口,从监控情况来看,是正常的。
命令也不多,那么为什么cpu资源消耗那么多呢?又是一个新的问题
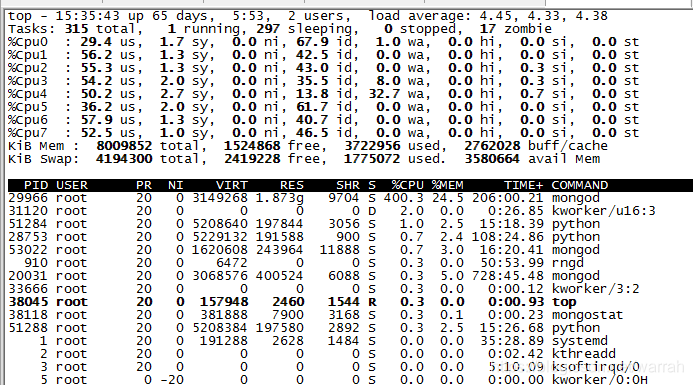
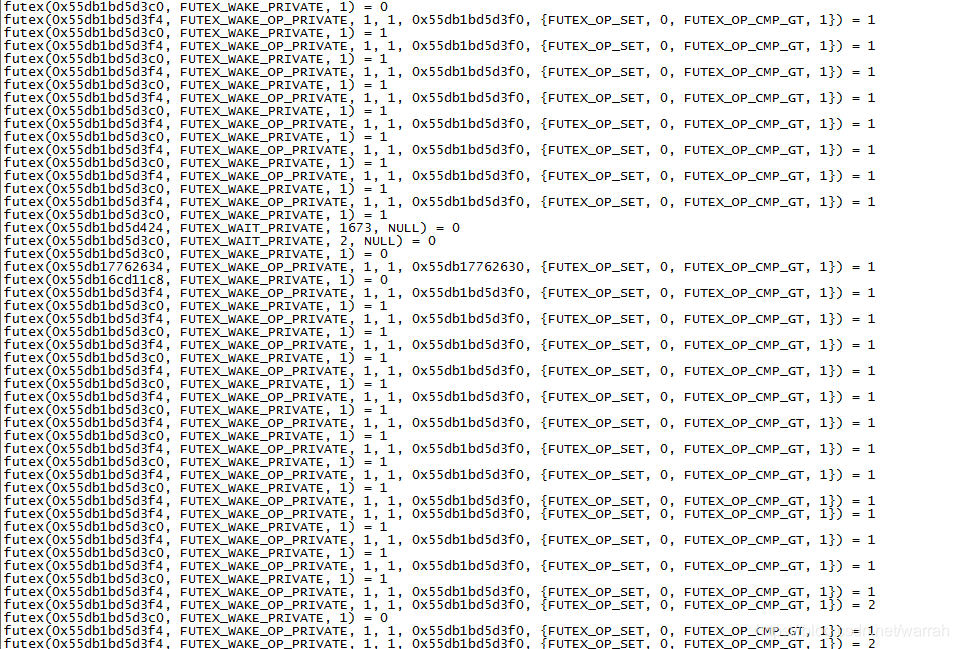
这个时候执行strace -c -f -p 29966命令,查看看mongo进程(就是上图中mongo的pid 29966)在做什么.futex存在大量的errors,那么这个异常到底是什么呢。
strace: Process 29966 attached with 43 threads

% time     seconds  usecs/call     calls    errors syscall
------ ----------- ----------- --------- --------- ----------------
 55.76  170.648266        1534    111236     32435 futex
 25.46   77.929580         495    157479           select
  8.18   25.046580      491109        51           epoll_wait
  3.89   11.903362       23665       503           nanosleep
  3.05    9.337090          31    303626           sched_yield
  1.90    5.815084      646120         9         8 restart_syscall
  0.97    2.960133          59     50568           pread64
  0.52    1.590114          67     23672           pwrite64
  0.08    0.231754         432       537           close
  0.07    0.202874        1691       120           munmap
  0.06    0.180727          72      2509           clock_gettime
  0.02    0.050079         642        78        10 recvmsg
  0.01    0.040506       40506         1           fdatasync
  0.01    0.039250          55       716           read
  0.01    0.016060          38       421           open
  0.00    0.013101          57       228           getdents
  0.00    0.008308          73       114           openat
  0.00    0.005967         101        59           getrusage
  0.00    0.003946          33       118           stat
  0.00    0.003379          28       120           fstat
  0.00    0.002798          82        34           sendmsg
  0.00    0.002584          22       120           mmap
  0.00    0.001682         140        12           madvise
  0.00    0.001264          37        34           poll
  0.00    0.000810          34        24           timerfd_settime
  0.00    0.000733         122         6           rename
  0.00    0.000233         117         2         2 connect
  0.00    0.000143          72         2           socket
  0.00    0.000137          17         8           writev
  0.00    0.000128          26         5           epoll_ctl
  0.00    0.000089          45         2           ioctl
  0.00    0.000011           6         2           getsockopt
  0.00    0.000009           5         2         1 lstat
  0.00    0.000000           0         2           write
  0.00    0.000000           0         1           unlink
------ ----------- ----------- --------- --------- ----------------
100.00  306.036781                652421     32456 total
You have mail in /var/spool/mail/root
查看Mongodb erverStatus was very slow 问题跟踪,他的问题是卡在recvfrom,我消耗cpu和大量错误的都是futex,那么futext到底是什么呢?查看futex机制介绍
Futex是一种用户态和内核态混合的同步机制,那么这个系统调用多,说明什么呢?再看另外一篇文章Linux MongoDB系统性能分析,他的问题也是如此,他的建议是升级内核,Nodes appear unresponsive due to a Linux futex_wait() kernel bug
那我们就照着他的命令试试,结果却不能正确执行。通过mongostat命令查看的,162的连接数很少,那怎么有那么多futex调用呢?Nodes appear unresponsive due to a Linux futex_wait() kernel bug,可以看到这个命令并不是升级内核,而是检测是否是否安装Here is an example to check on a RHEL server for the installed patches:
[root@bwhs162 ~]# sudo rpm -q --changelog kernel-`uname -r` | grep futex | grep ref
- [kernel] futex: Mention key referencing differences between shared and private futexes (Larry Woodman) [1205862]
- [kernel] futex: Ensure get_futex_key_refs() always implies a barrier (Larry Woodman) [1205862]
You have mail in /var/spool/mail/root
这个时候,我想到是否可以找一台正常的机器查查看,正常的mongo,有7个线程,而异常的却有43个,而且虽然mongo的连接数很多,但并没有占大量cpu的是select调用,而不是futex。既然mongo的连接数不多,却为何有那么多的线程呢?
strace: Process 53676 attached with 7 threads


^Cstrace: Process 53676 detached
strace: Process 53682 detached
strace: Process 53683 detached
strace: Process 53684 detached
strace: Process 53687 detached
strace: Process 53688 detached
strace: Process 53689 detached
% time     seconds  usecs/call     calls    errors syscall
------ ----------- ----------- --------- --------- ----------------
 96.44    1.477481        2592       570           select
  2.39    0.036645          14      2690           recvfrom
  0.51    0.007775           6      1322       246 futex
  0.42    0.006461           5      1201           sendto
  0.08    0.001232           2       736       736 connect
  0.07    0.001005           1       736           close
  0.05    0.000718           1       736           socket
  0.04    0.000597           5       123           poll
  0.00    0.000045          11         4           shutdown
  0.00    0.000043           5         9           mmap
  0.00    0.000002           1         2           write
  0.00    0.000001           0         8           ioctl
  0.00    0.000000           0         8           munmap
  0.00    0.000000           0         4           setsockopt
  0.00    0.000000           0         4           getsockopt
  0.00    0.000000           0         2           getrandom
------ ----------- ----------- --------- --------- ----------------
100.00    1.532005                  8155       982 total

insert query update delete getmore command flushes mapped vsize   res faults qrw arw net_in net_out conn                time
    *0    *0     *0     *0       0    24|0       0     0B 1.02G 74.0M      0 0|0 0|0  4.62k   41.2k  662 May 22 16:33:03.591
     6    *0     *0     *0       0    96|0       0     0B 1.02G 74.0M      0 0|0 0|0  21.0k   62.3k  662 May 22 16:33:04.591
    *0    *0     *0     *0       0    95|0       0     0B 1.02G 74.0M      0 0|0 0|0  19.1k   63.2k  662 May 22 16:33:05.591
    *0    *0     *0     *0       0    98|0       0     0B 1.02G 74.0M      0 0|0 0|0  19.2k   64.1k  662 May 22 16:33:06.596
    *0    *0     *0     *0       0    24|0       0     0B 1.02G 74.0M      0 0|0 0|0  5.13k   37.6k  662 May 22 16:33:07.603
     3    *0     *0     *0       0    31|0       0     0B 1.02G 74.0M      0 0|0 0|0  7.19k   40.2k  662 May 22 16:33:08.591
     1    *0     *0     *0       0     8|0       0     0B 1.02G 74.0M      0 0|0 0|0  2.39k   32.0k  662 May 22 16:33:09.592
     1    *0     *0     *0       0     9|0       0     0B 1.02G 74.0M      0 0|0 0|0  2.58k   32.2k  662 May 22 16:33:10.598
    *0    *0     *0     *0       0    10|0       0     0B 1.02G 74.0M      0 0|0 0|0  2.04k   33.0k  662 May 22 16:33:11.602
     1    *0     *0     *0       0    15|0       0     0B 1.02G 74.0M      0 0|0 0|0  3.29k   34.6k  662 May 22 16:33:12.595
如果使用strace -p 29966进行调试,那么请问大神,这些调试信息,又有几个看的懂,反正我是看不懂,那又如何帮我们找到解决方案呢,亲。
再回过头来,我们看看162上面,shard1、shard2、shard3的日志,下面是shard2的日志,他说shard1影响了自己
2019-05-22T17:13:48.374+0800 I CONTROL [LogicalSessionCacheRefresh] Failed to refresh session cache: WriteConcernFailed: waiting for replication timed out; Error details: { wtimeout: true } at shard1
下面是shard3的日志,他到没有怪shard1,而是说shard状态没有初始化。
2019-05-22T17:23:24.120+0800 I CONTROL  [LogicalSessionCacheRefresh] Sessions collection is not set up; waiting until next sessions refresh interval: sharding state is not yet initialized
2019-05-22T17:23:24.219+0800 I CONTROL  [LogicalSessionCacheReap] Sessions collection is not set up; waiting until next sessions reap interval: sharding state is not yet initialized
大多数节点都可以起来后,发现有两台机器的同一分片存在问题,没法启动,另外还有一台是可以起来的。参考MongoDB 副本集分片集群一分片config库主机断电导致该分片config库无法启动,我尝试将没问题的config中data目录,替换异常的节点,问题依旧存在
2019-05-28T10:57:33.047+0800 W NETWORK  [ReplicaSetMonitor-TaskExecutor] Unable to reach primary for set shard1
2019-05-28T10:57:33.047+0800 I NETWORK  [ReplicaSetMonitor-TaskExecutor] Cannot reach any nodes for set shard1. Please check network connectivity and the status of the set. This has happened for 11 checks in a row.
