内容概览
1.基于openlayers6结合geoserver实现地图矢量瓦片
2.源代码demo下载
效果图如下: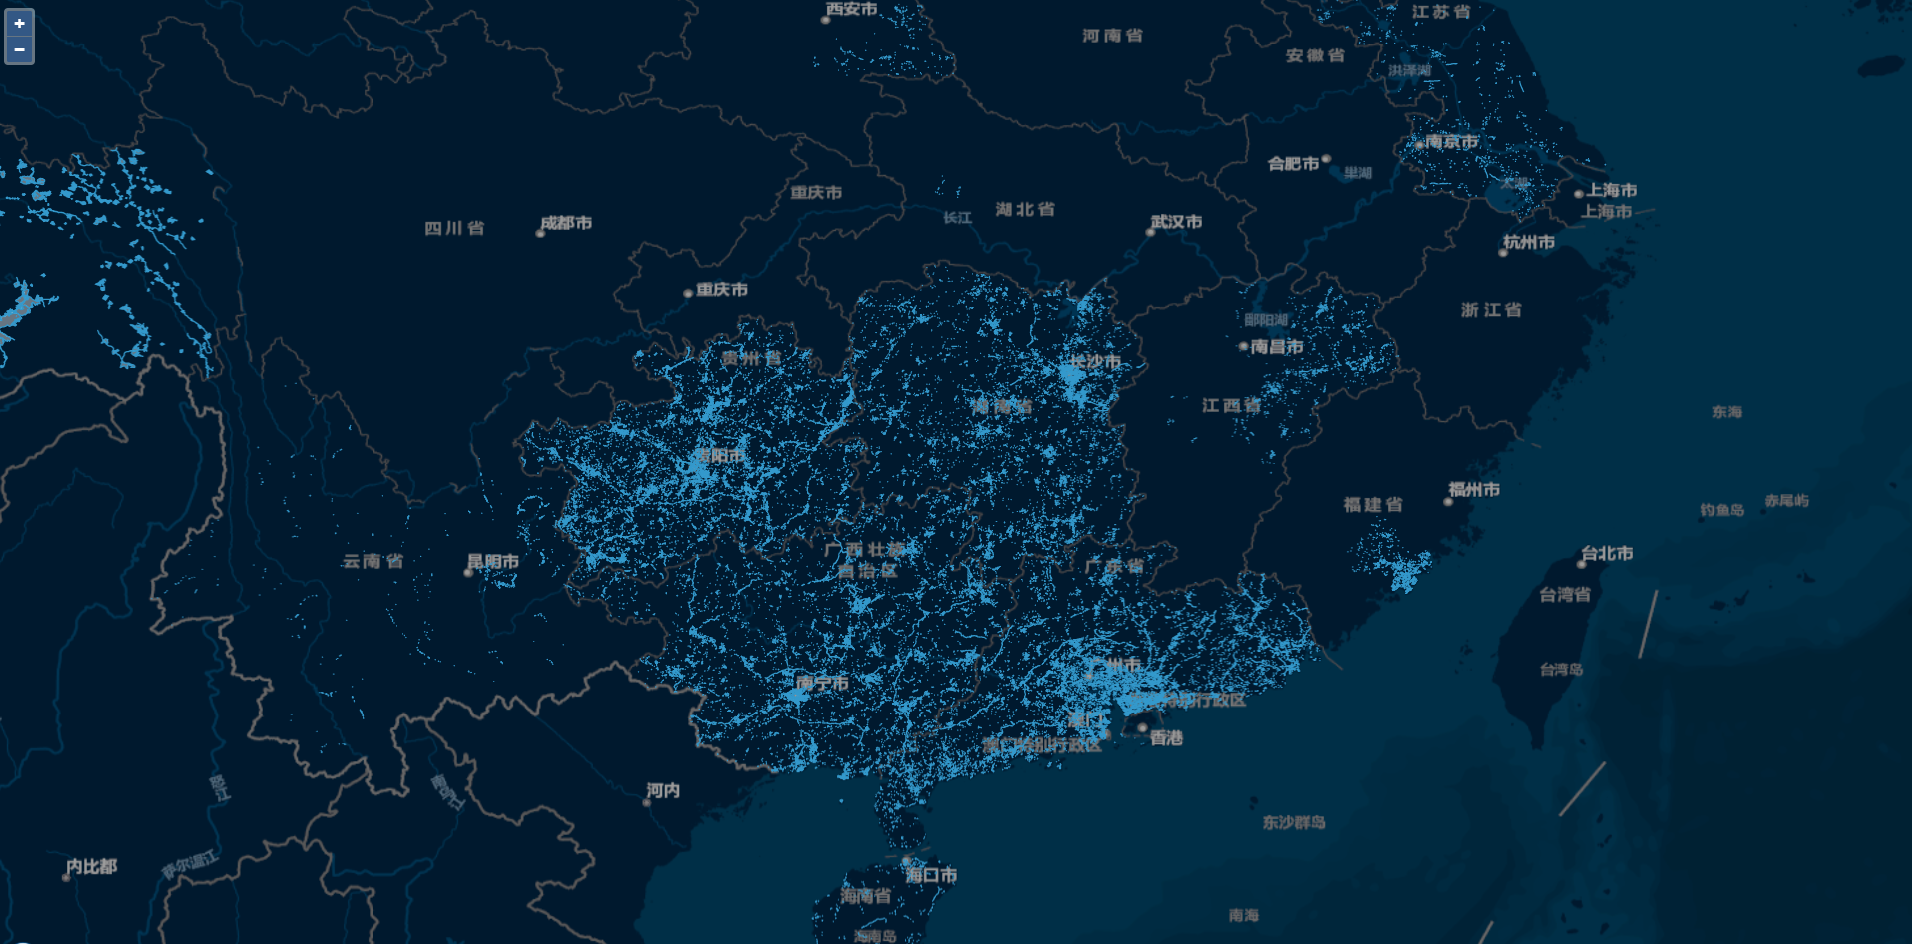
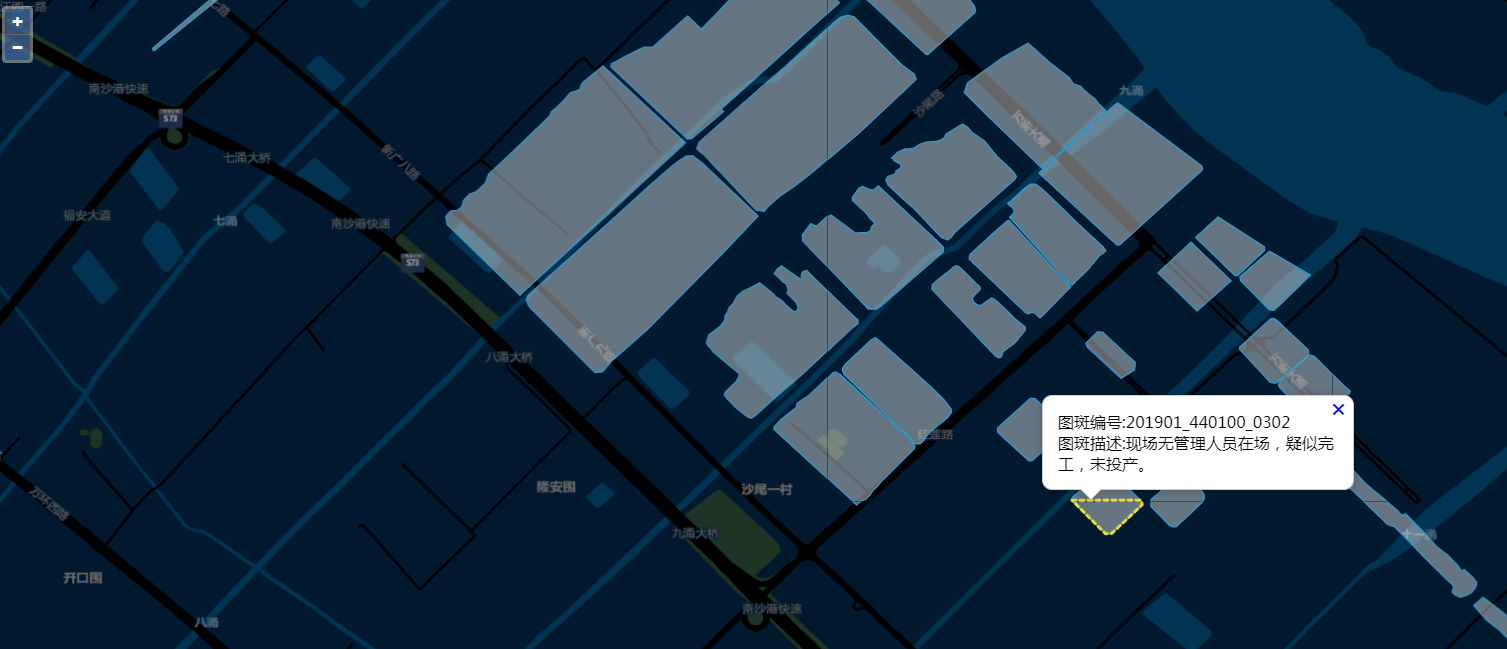
实现思路:利用Geoserver发布矢量切片服务,然后openlayers调用矢量瓦片服务渲染加载,geoserver发布矢量服务步骤自行百度搜索相关教程,网上很多。最后,通过地图点击事件交互,实现图形高亮以及气泡窗口显示信息详情效果。
具体实现过程
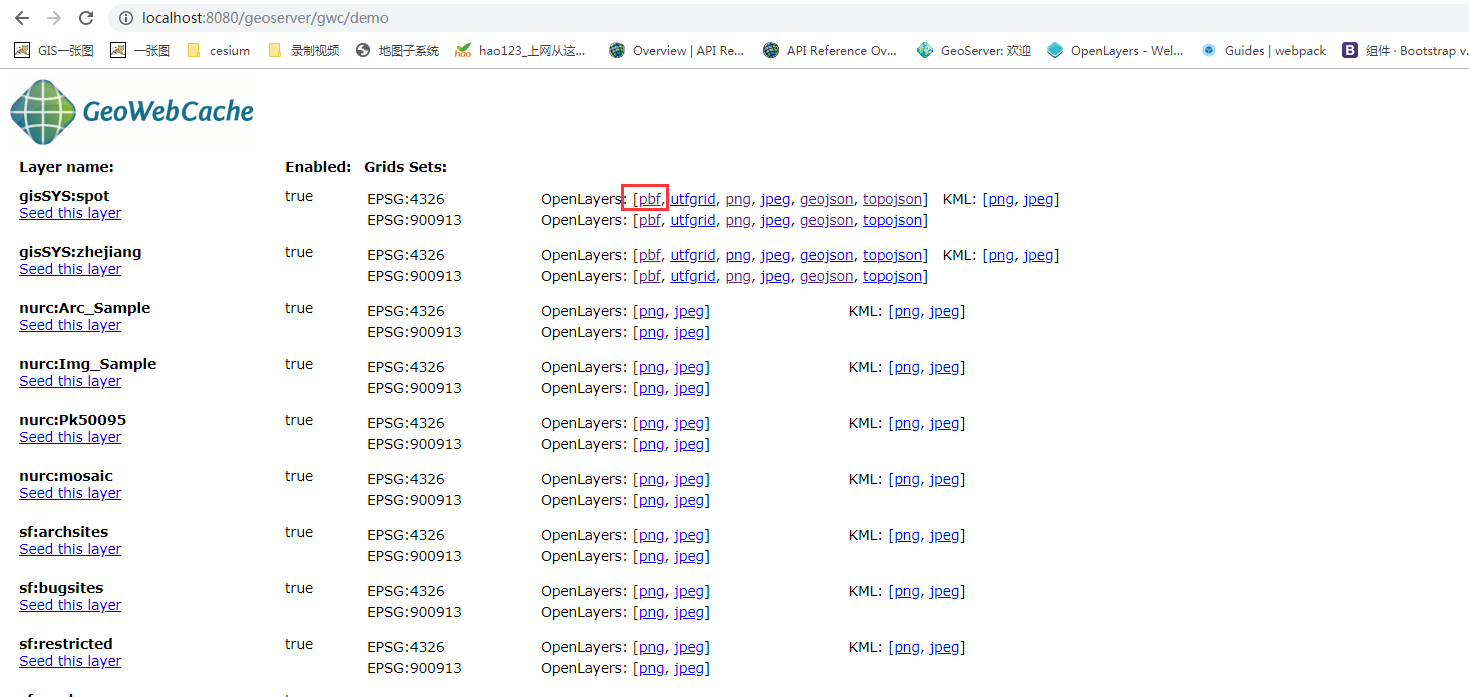
- 利用geoserver发布好的矢量瓦片服务预览效果,直接F12看源码,来对应整合到demo
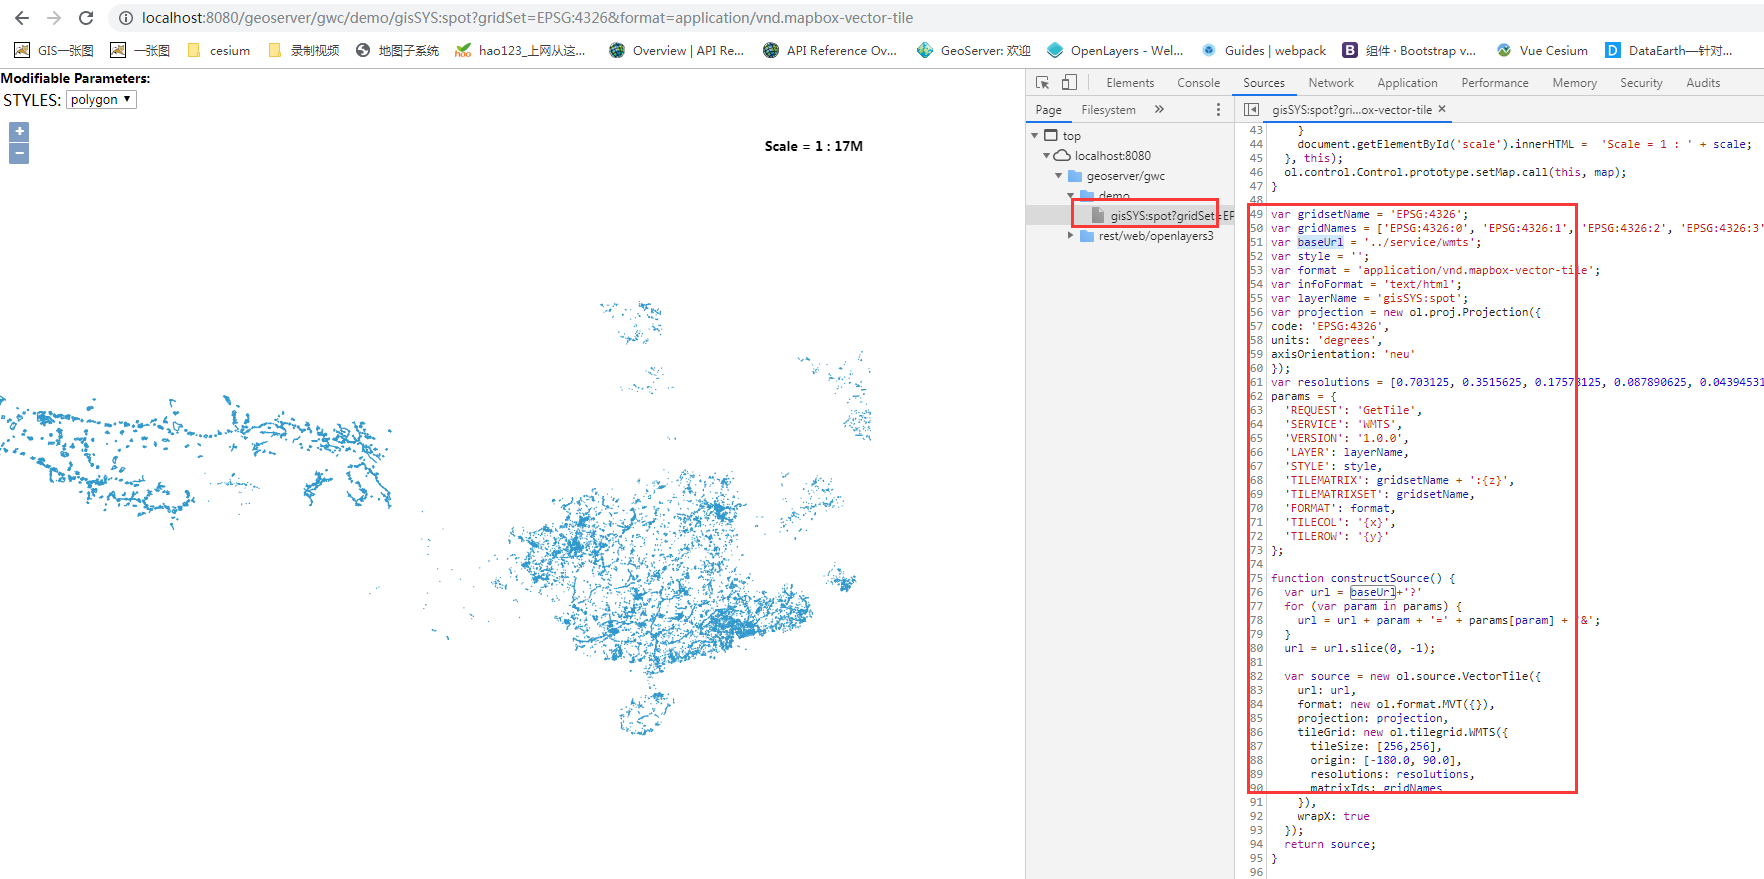
var geojsonLayer = new ol.layer.Vector({
source: new ol.source.Vector(),
style: geoJsonStyle
});
var gridsetName = 'EPSG:4326';
var gridNames = ['EPSG:4326:0', 'EPSG:4326:1', 'EPSG:4326:2', 'EPSG:4326:3', 'EPSG:4326:4', 'EPSG:4326:5', 'EPSG:4326:6', 'EPSG:4326:7', 'EPSG:4326:8', 'EPSG:4326:9', 'EPSG:4326:10', 'EPSG:4326:11', 'EPSG:4326:12', 'EPSG:4326:13', 'EPSG:4326:14', 'EPSG:4326:15', 'EPSG:4326:16', 'EPSG:4326:17', 'EPSG:4326:18', 'EPSG:4326:19', 'EPSG:4326:20', 'EPSG:4326:21'];
var baseUrl = 'http://localhost:8080/geoserver/gwc/service/wmts';//基础请求URL
var style = '';
var format = 'application/vnd.mapbox-vector-tile';
var infoFormat = 'text/html';
var layerName = 'gisSYS:spot';
var projection = new ol.proj.Projection({
code: 'EPSG:4326',
units: 'degrees',
axisOrientation: 'neu'
});
var resolutions = [0.703125, 0.3515625, 0.17578125, 0.087890625, 0.0439453125, 0.02197265625, 0.010986328125, 0.0054931640625, 0.00274658203125, 0.001373291015625, 6.866455078125E-4, 3.4332275390625E-4, 1.71661376953125E-4, 8.58306884765625E-5, 4.291534423828125E-5, 2.1457672119140625E-5, 1.0728836059570312E-5, 5.364418029785156E-6, 2.682209014892578E-6, 1.341104507446289E-6, 6.705522537231445E-7, 3.3527612686157227E-7];
params = {
'REQUEST': 'GetTile',
'SERVICE': 'WMTS',
'VERSION': '1.0.0',
'LAYER': layerName,
'STYLE': style,
'TILEMATRIX': gridsetName + ':{z}',
'TILEMATRIXSET': gridsetName,
'FORMAT': format,
'TILECOL': '{x}',
'TILEROW': '{y}'
};

function constructSource() {
var url = baseUrl+'?'
for (var param in params) {
url = url + param + '=' + params[param] + '&';
}
url = url.slice(0, -1);

var source = new ol.source.VectorTile({
url: url,
format: new ol.format.MVT({}),
projection: projection,
tileGrid: new ol.tilegrid.WMTS({
tileSize: [256,256],
origin: [-180.0, 90.0],
resolutions: resolutions,
matrixIds: gridNames
}),
wrapX: true
});
return source;
}

var layer = new ol.layer.VectorTile({
source: constructSource()
});

var baseLayer = new ol.layer.Tile({
source: new ol.source.TileArcGISRest({
url: 'http://map.geoq.cn/ArcGIS/rest/services/ChinaOnlineStreetPurplishBlue/MapServer'
})
});

var view = new ol.View({
center: [0, 0],
zoom: 2,
projection: projection,
extent: [-180.0,-90.0,180.0,90.0]
});

var map = new ol.Map({
layers: [
baseLayer,
layer,
geojsonLayer
],
overlays: [overlay],
target: 'map',
view: view
});
map.getView().fit([79.12713276900007,18.240437474000032,121.92670103300003,37.46491935100004], map.getSize());
- 地图点击交互高亮弹窗
//监听地图鼠标移动事件singleclick
//map.on('pointermove',function(e) {
map.on('singleclick',function(e) {
if (e.dragging) {
return;
}
var feature =map.forEachFeatureAtPixel(e.pixel,
function(feature) {
return feature;
});
……
完整demo源码见小专栏文章尾部:GIS之家小专栏
文章尾部提供源代码下载,对本专栏感兴趣的话,可以关注一波