转载:https://blog.csdn.net/SHU15121856/article/details/88818539
转载:https://zhuanlan.zhihu.com/p/98563580
visdom codes: https://github.com/facebookresearch/visdom
具体demo使用及demo可参考:https://github.com/facebookresearch/visdom/blob/master/example/demo.py
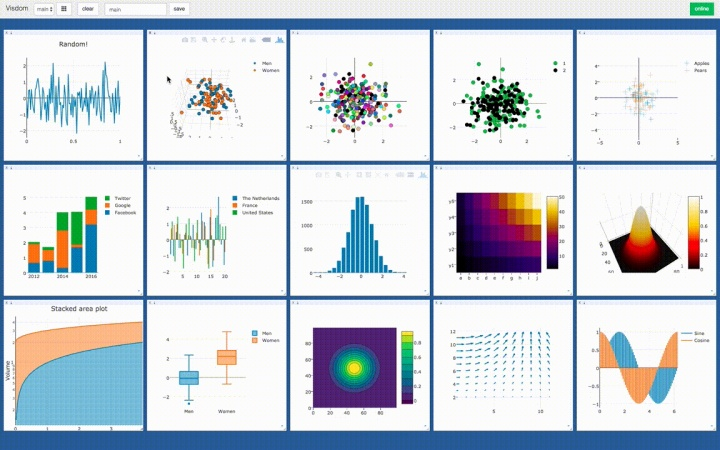
Visdom 是一个 facebook团队开发的专门用于交互式可视化工具,可以对实时数据进行丰富的可视化,帮助我们实时监控在远程服务器上进行的科学实验。
Visdom 的可视化可以在浏览器中查看,并且很容易地与其他人进行共享可视化结果。Visdom 的可视化类型种类非常多。
安装并启动 visdom
pip安装:pip install visdom
源码安装:先从Github上下载Visdom的源码,进入解压后的目录,执行:pip install -e .,即从当前目录下的setup.py安装了Visdom。
开启 visdom 服务:python -m visdom.server
会出现如下信息:

Checking for scripts.
 It's Alive!
 INFO:root:Application Started
 You can navigate to http://localhost:8097
如果是在本机开启的服务,则在浏览器中输入http://localhost:8097,如果是在服务器开启的服务,则在本机浏览器中输入http://[server_ip]:8097。
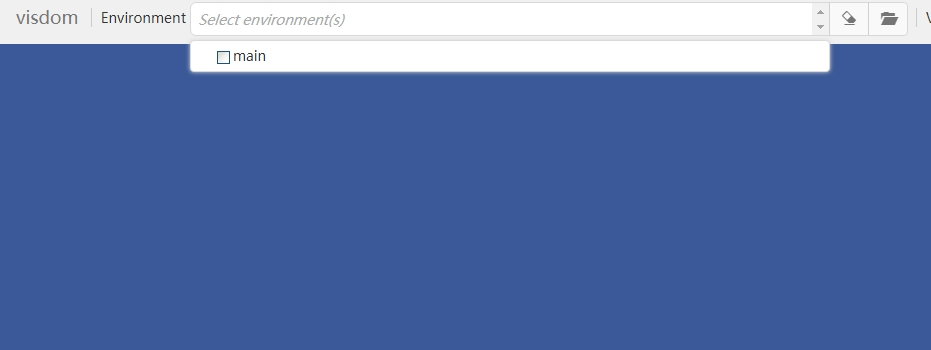
此时就会启动 visdom,默认是在 main 环境下:如果要同时或者先后训练不同的网络模型,我们可以为每个模型创建一个环境,分别显示它们的可视化结果。
viz = Visdom(port=FLAGS.port, server=FLAGS.server, base_url=FLAGS.base_url, username=FLAGS.username, password=FLAGS.password, \
                use_incoming_socket=FLAGS.use_incoming_socket)
具体使用
from visdom import Visdom

viz = Visdom(env='demo')
viz.line([0.], [0.], win='train_loss', opts=dict(title='train loss'))
viz.line([[0.0, 0.0]], [0.], win='test', opts=dict(title='test loss&acc.',
          legend=['loss', 'acc.']))
viz.line的前两个参数是曲线的Y和X的坐标(前面是纵轴后面才是横轴),这里为了占位所以都设置了0(实际上为Loss初始Y值设置为0的话,在图中刚开始的地方会有个大跳跃有点难看,因为Loss肯定是从大往小了走的)。为它们设置了不同的win参数,它们就会在不同的窗口中展示,因为第三步定义的是测试集的loss和acc两条曲线,所以在X等于0时Y给了两个初始值。
global_step += 1
viz.line([loss.item()], [global_step], win='train_loss', update='append')
注意这里用win参数来选择是哪条曲线,用update='append'的方式添加曲线的增长点,前面是Y坐标,后面是X坐标,Y 表示纵坐标,如果没有指定横坐标,则默认横坐标范围为(0,1)。Y可以是numpy 数组,Python list和pytorch的tensor。
# Numpy Array
viz.line(Y=arr)
# Python List
viz.line(Y=list(arr))
# PyTorch tensor
viz.line(Y=torch.Tensor(arr))
在每次测试结束后,也可以(用win参数设置)中展示图像(.images)和真实值(文本用.text):
viz.line([[test_loss, correct / len(test_loader.dataset)]], # 这里在同一个win里面绘画了两条曲线,第一条显示的test_loss,第二条显示的correct值;
             [global_step], win='test', update='append')
viz.images(data.view(-1, 1, 28, 28), win='x')
viz.text(str(pred.detach().cpu().numpy()), win='pred',
             opts=dict(title='pred'))
具体可参考官方的示例,绘制各种各样的曲线:
#!/usr/bin/env python3

# Copyright 2017-present, Facebook, Inc.
# All rights reserved.
#
# This source code is licensed under the license found in the
# LICENSE file in the root directory of this source tree.

from visdom import Visdom
import argparse
import numpy as np
import math
import os.path
import time
import tempfile
import urllib


def run_demo(viz):
    global input
    assert viz.check_connection(timeout_seconds=3), \
        'No connection could be formed quickly'

    textwindow = viz.text('Hello World!')

    updatetextwindow = viz.text('Hello World! More text should be here')
    assert updatetextwindow is not None, 'Window was none'
    viz.text('And here it is', win=updatetextwindow, append=True)

    # text window with Callbacks
    txt = 'This is a write demo notepad. Type below. Delete clears text:<br>'
    callback_text_window = viz.text(txt)

    def type_callback(event):
        if event['event_type'] == 'KeyPress':
            curr_txt = event['pane_data']['content']
            if event['key'] == 'Enter':
                curr_txt += '<br>'
            elif event['key'] == 'Backspace':
                curr_txt = curr_txt[:-1]
            elif event['key'] == 'Delete':
                curr_txt = txt
            elif len(event['key']) == 1:
                curr_txt += event['key']
            viz.text(curr_txt, win=callback_text_window)

    viz.register_event_handler(type_callback, callback_text_window)

    # matplotlib demo:
    try:
        import matplotlib.pyplot as plt
        plt.plot([1, 23, 2, 4])
        plt.ylabel('some numbers')
        viz.matplot(plt)
    except BaseException as err:
        print('Skipped matplotlib example')
        print('Error message: ', err)

    # video demo:
    try:
        video = np.empty([256, 250, 250, 3], dtype=np.uint8)
        for n in range(256):
            video[n, :, :, :].fill(n)
        viz.video(tensor=video)
    except BaseException:
        print('Skipped video tensor example')

    try:
        # video demo:
        # download video from http://media.w3.org/2010/05/sintel/trailer.ogv
        video_url = 'http://media.w3.org/2010/05/sintel/trailer.ogv'
        videofile = os.path.join(tempfile.gettempdir(), 'trailer.ogv')
        urllib.request.urlretrieve(video_url, videofile)

        if os.path.isfile(videofile):
            viz.video(videofile=videofile, opts={'width': 864, 'height': 480})
    except BaseException as e:
        print('Skipped video file example', e)

    # image demo
    img_callback_win = viz.image(
        np.random.rand(3, 512, 256),
        opts={'title': 'Random!', 'caption': 'Click me!'},
    )

    img_coord_text = viz.text("Coords: ")

    def img_click_callback(event):
        nonlocal img_coord_text
        if event['event_type'] != 'Click':
            return

        coords = "x: {}, y: {};".format(
            event['image_coord']['x'], event['image_coord']['y']
        )
        img_coord_text = viz.text(coords, win=img_coord_text, append=True)

    viz.register_event_handler(img_click_callback, img_callback_win)

    # image demo save as jpg
    viz.image(
        np.random.rand(3, 512, 256),
        opts=dict(title='Random image as jpg!', caption='How random as jpg.', jpgquality=50),
    )

    # image history demo
    viz.image(
        np.random.rand(3, 512, 256),
        win='image_history',
        opts=dict(caption='First random', store_history=True, title='Pick your random!'),
    )
    viz.image(
        np.random.rand(3, 512, 256),
        win='image_history',
        opts=dict(caption='Second random!', store_history=True),
    )

    # grid of images
    viz.images(
        np.random.randn(20, 3, 64, 64),
        opts=dict(title='Random images', caption='How random.')
    )

    # scatter plots
    Y = np.random.rand(100)
    old_scatter = viz.scatter(
        X=np.random.rand(100, 2),
        Y=(Y[Y > 0] + 1.5).astype(int),
        opts=dict(
            legend=['Didnt', 'Update'],
            xtickmin=-50,
            xtickmax=50,
            xtickstep=0.5,
            ytickmin=-50,
            ytickmax=50,
            ytickstep=0.5,
            markersymbol='cross-thin-open',
        ),
    )

    viz.update_window_opts(
        win=old_scatter,
        opts=dict(
            legend=['Apples', 'Pears'],
            xtickmin=0,
            xtickmax=1,
            xtickstep=0.5,
            ytickmin=0,
            ytickmax=1,
            ytickstep=0.5,
            markersymbol='cross-thin-open',
        ),
    )

    # 3d scatterplot with custom labels and ranges
    viz.scatter(
        X=np.random.rand(100, 3),
        Y=(Y + 1.5).astype(int),
        opts=dict(
            legend=['Men', 'Women'],
            markersize=5,
            xtickmin=0,
            xtickmax=2,
            xlabel='Arbitrary',
            xtickvals=[0, 0.75, 1.6, 2],
            ytickmin=0,
            ytickmax=2,
            ytickstep=0.5,
            ztickmin=0,
            ztickmax=1,
            ztickstep=0.5,
        )
    )

    # 2D scatterplot with custom intensities (red channel)
    viz.scatter(
        X=np.random.rand(255, 2),
        Y=(np.random.rand(255) + 1.5).astype(int),
        opts=dict(
            markersize=10,
            markercolor=np.random.randint(0, 255, (2, 3,)),
        ),
    )

    # 2D scatter plot with custom colors per label:
    viz.scatter(
        X=np.random.rand(255, 2),
        Y=(np.random.randn(255) > 0) + 1,
        opts=dict(
            markersize=10,
            markercolor=np.floor(np.random.random((2, 3)) * 255),
        ),
    )

    win = viz.scatter(
        X=np.random.rand(255, 2),
        opts=dict(
            markersize=10,
            markercolor=np.random.randint(0, 255, (255, 3,)),
        ),
    )

    # assert that the window exists
    assert viz.win_exists(win), 'Created window marked as not existing'

    # add new trace to scatter plot
    viz.scatter(
        X=np.random.rand(255),
        Y=np.random.rand(255),
        win=win,
        name='new_trace',
        update='new'
    )

    # 2D scatter plot with text labels:
    viz.scatter(
        X=np.random.rand(10, 2),
        opts=dict(
            textlabels=['Label %d' % (i + 1) for i in range(10)]
        )
    )
    viz.scatter(
        X=np.random.rand(10, 2),
        Y=[1] * 5 + [2] * 3 + [3] * 2,
        opts=dict(
            legend=['A', 'B', 'C'],
            textlabels=['Label %d' % (i + 1) for i in range(10)]
        )
    )

    # bar plots
    viz.bar(X=np.random.rand(20))
    viz.bar(
        X=np.abs(np.random.rand(5, 3)),
        opts=dict(
            stacked=True,
            legend=['Facebook', 'Google', 'Twitter'],
            rownames=['2012', '2013', '2014', '2015', '2016']
        )
    )
    viz.bar(
        X=np.random.rand(20, 3),
        opts=dict(
            stacked=False,
            legend=['The Netherlands', 'France', 'United States']
        )
    )

    # histogram
    viz.histogram(X=np.random.rand(10000), opts=dict(numbins=20))

    # heatmap
    viz.heatmap(
        X=np.outer(np.arange(1, 6), np.arange(1, 11)),
        opts=dict(
            columnnames=['a', 'b', 'c', 'd', 'e', 'f', 'g', 'h', 'i', 'j'],
            rownames=['y1', 'y2', 'y3', 'y4', 'y5'],
            colormap='Electric',
        )
    )

    # contour
    x = np.tile(np.arange(1, 101), (100, 1))
    y = x.transpose()
    X = np.exp((((x - 50) ** 2) + ((y - 50) ** 2)) / -(20.0 ** 2))
    viz.contour(X=X, opts=dict(colormap='Viridis'))

    # surface
    viz.surf(X=X, opts=dict(colormap='Hot'))

    # line plots
    viz.line(Y=np.random.rand(10), opts=dict(showlegend=True))

    Y = np.linspace(-5, 5, 100)
    viz.line(
        Y=np.column_stack((Y * Y, np.sqrt(Y + 5))),
        X=np.column_stack((Y, Y)),
        opts=dict(markers=False),
    )

    # line using WebGL
    webgl_num_points = 200000
    webgl_x = np.linspace(-1, 0, webgl_num_points)
    webgl_y = webgl_x**3
    viz.line(X=webgl_x, Y=webgl_y,
             opts=dict(title='{} points using WebGL'.format(webgl_num_points), webgl=True),
             win="WebGL demo")


    # line updates
    win = viz.line(
        X=np.column_stack((np.arange(0, 10), np.arange(0, 10))),
        Y=np.column_stack((np.linspace(5, 10, 10),
                           np.linspace(5, 10, 10) + 5)),
    )
    viz.line(
        X=np.column_stack((np.arange(10, 20), np.arange(10, 20))),
        Y=np.column_stack((np.linspace(5, 10, 10),
                           np.linspace(5, 10, 10) + 5)),
        win=win,
        update='append'
    )
    viz.line(
        X=np.arange(21, 30),
        Y=np.arange(1, 10),
        win=win,
        name='2',
        update='append'
    )
    viz.line(
        X=np.arange(1, 10),
        Y=np.arange(11, 20),
        win=win,
        name='delete this',
        update='append'
    )
    viz.line(
        X=np.arange(1, 10),
        Y=np.arange(11, 20),
        win=win,
        name='4',
        update='insert'
    )
    viz.line(X=None, Y=None, win=win, name='delete this', update='remove')

    viz.line(
        X=webgl_x+1.,
        Y=(webgl_x+1.)**3,
        win="WebGL demo",
        update='append',
        opts=dict(title='{} points using WebGL'.format(webgl_num_points*2), webgl=True)
    )

    win = viz.line(
        X=np.column_stack((
            np.arange(0, 10),
            np.arange(0, 10),
            np.arange(0, 10),
        )),
        Y=np.column_stack((
            np.linspace(5, 10, 10),
            np.linspace(5, 10, 10) + 5,
            np.linspace(5, 10, 10) + 10,
        )),
        opts={
            'dash': np.array(['solid', 'dash', 'dashdot']),
            'linecolor': np.array([
                [0, 191, 255],
                [0, 191, 255],
                [255, 0, 0],
            ]),
            'title': 'Different line dash types'
        }
    )

    viz.line(
        X=np.arange(0, 10),
        Y=np.linspace(5, 10, 10) + 15,
        win=win,
        name='4',
        update='insert',
        opts={
            'linecolor': np.array([
                [255, 0, 0],
            ]),
            'dash': np.array(['dot']),
        }
    )

    Y = np.linspace(0, 4, 200)
    win = viz.line(
        Y=np.column_stack((np.sqrt(Y), np.sqrt(Y) + 2)),
        X=np.column_stack((Y, Y)),
        opts=dict(
            fillarea=True,
            showlegend=False,
            width=800,
            height=800,
            xlabel='Time',
            ylabel='Volume',
            ytype='log',
            title='Stacked area plot',
            marginleft=30,
            marginright=30,
            marginbottom=80,
            margintop=30,
        ),
    )

    # Assure that the stacked area plot isn't giant
    viz.update_window_opts(
        win=win,
        opts=dict(
            width=300,
            height=300,
        ),
    )

    # boxplot
    X = np.random.rand(100, 2)
    X[:, 1] += 2
    viz.boxplot(
        X=X,
        opts=dict(legend=['Men', 'Women'])
    )

    # stemplot
    Y = np.linspace(0, 2 * math.pi, 70)
    X = np.column_stack((np.sin(Y), np.cos(Y)))
    viz.stem(
        X=X,
        Y=Y,
        opts=dict(legend=['Sine', 'Cosine'])
    )

    # quiver plot
    X = np.arange(0, 2.1, .2)
    Y = np.arange(0, 2.1, .2)
    X = np.broadcast_to(np.expand_dims(X, axis=1), (len(X), len(X)))
    Y = np.broadcast_to(np.expand_dims(Y, axis=0), (len(Y), len(Y)))
    U = np.multiply(np.cos(X), Y)
    V = np.multiply(np.sin(X), Y)
    viz.quiver(
        X=U,
        Y=V,
        opts=dict(normalize=0.9),
    )

    # pie chart
    X = np.asarray([19, 26, 55])
    viz.pie(
        X=X,
        opts=dict(legend=['Residential', 'Non-Residential', 'Utility'])
    )

    # scatter plot example with various type of updates
    colors = np.random.randint(0, 255, (2, 3,))
    win = viz.scatter(
        X=np.random.rand(255, 2),
        Y=(np.random.rand(255) + 1.5).astype(int),
        opts=dict(
            markersize=10,
            markercolor=colors,
            legend=['1', '2']
        ),
    )

    viz.scatter(
        X=np.random.rand(255),
        Y=np.random.rand(255),
        opts=dict(
            markersize=10,
            markercolor=colors[0].reshape(-1, 3),

        ),
        name='1',
        update='append',
        win=win)

    viz.scatter(
        X=np.random.rand(255, 2),
        Y=(np.random.rand(255) + 1.5).astype(int),
        opts=dict(
            markersize=10,
            markercolor=colors,
        ),
        update='append',
        win=win)

    # mesh plot
    x = [0, 0, 1, 1, 0, 0, 1, 1]
    y = [0, 1, 1, 0, 0, 1, 1, 0]
    z = [0, 0, 0, 0, 1, 1, 1, 1]
    X = np.c_[x, y, z]
    i = [7, 0, 0, 0, 4, 4, 6, 6, 4, 0, 3, 2]
    j = [3, 4, 1, 2, 5, 6, 5, 2, 0, 1, 6, 3]
    k = [0, 7, 2, 3, 6, 7, 1, 1, 5, 5, 7, 6]
    Y = np.c_[i, j, k]
    viz.mesh(X=X, Y=Y, opts=dict(opacity=0.5))

    # SVG plotting
    svgstr = """
    <svg height="300" width="300">
      <ellipse cx="80" cy="80" rx="50" ry="30"
       style="fill:red;stroke:purple;stroke-width:2" />
      Sorry, your browser does not support inline SVG.
    </svg>
    """
    viz.svg(
        svgstr=svgstr,
        opts=dict(title='Example of SVG Rendering')
    )

    # close text window:
    viz.close(win=textwindow)

    # assert that the closed window doesn't exist
    assert not viz.win_exists(textwindow), 'Closed window still exists'

    # Arbitrary visdom content
    trace = dict(x=[1, 2, 3], y=[4, 5, 6], mode="markers+lines", type='custom',
                 marker={'color': 'red', 'symbol': 104, 'size': "10"},
                 text=["one", "two", "three"], name='1st Trace')
    layout = dict(title="First Plot", xaxis={'title': 'x1'},
                  yaxis={'title': 'x2'})

    viz._send({'data': [trace], 'layout': layout, 'win': 'mywin'})

    # PyTorch tensor
    try:
        import torch
        viz.line(Y=torch.Tensor([[0., 0.], [1., 1.]]))
    except ImportError:
        print('Skipped PyTorch example')

    # audio demo:
    tensor = np.random.uniform(-1, 1, 441000)
    viz.audio(tensor=tensor, opts={'sample_frequency': 441000})

    # audio demo:
    # download from http://www.externalharddrive.com/waves/animal/dolphin.wav
    try:
        audio_url = 'http://www.externalharddrive.com/waves/animal/dolphin.wav'
        audiofile = os.path.join(tempfile.gettempdir(), 'dolphin.wav')
        urllib.request.urlretrieve(audio_url, audiofile)

        if os.path.isfile(audiofile):
            viz.audio(audiofile=audiofile)
    except BaseException:
        print('Skipped audio example')

    # get/set state
    import json
    window = viz.text('test one')
    data = json.loads(viz.get_window_data())
    data[window]['content'] = 'test two'
    viz.set_window_data(json.dumps(data))

    try:
        input = raw_input  # for Python 2 compatibility
    except NameError:
        pass
    input('Waiting for callbacks, press enter to quit.')


if __name__ == '__main__':
    DEFAULT_PORT = 8097
    DEFAULT_HOSTNAME = "http://localhost"
    parser = argparse.ArgumentParser(description='Demo arguments')
    parser.add_argument('-port', metavar='port', type=int, default=DEFAULT_PORT,
                        help='port the visdom server is running on.')
    parser.add_argument('-server', metavar='server', type=str,
                        default=DEFAULT_HOSTNAME,
                        help='Server address of the target to run the demo on.')
    parser.add_argument('-base_url', metavar='base_url', type=str,
                    default='/',
                    help='Base Url.')
    parser.add_argument('-username', metavar='username', type=str,
                    default='',
                    help='username.')
    parser.add_argument('-password', metavar='password', type=str,
                    default='',
                    help='password.')
    parser.add_argument('-use_incoming_socket', metavar='use_incoming_socket', type=bool,
                    default=True,
                    help='use_incoming_socket.')
    FLAGS = parser.parse_args()

    try:
        viz = Visdom(port=FLAGS.port, server=FLAGS.server, base_url=FLAGS.base_url, username=FLAGS.username, password=FLAGS.password, \
                use_incoming_socket=FLAGS.use_incoming_socket)
        run_demo(viz)
    except Exception as e:
        print(
            "The visdom experienced an exception while running: {}\n"
            "The demo displays up-to-date functionality with the GitHub "
            "version, which may not yet be pushed to pip. Please upgrade "
            "using `pip install -e .` or `easy_install .`\n"
            "If this does not resolve the problem, please open an issue on "
            "our GitHub.".format(repr(e))
        )