很多小伙伴在日常日志分析方面都在使用 ES (ElasticSearch),但微软云 Azure 上没有原生的托管的 ES PaaS 服务。其实微软云上 Azure Data Explorer 是一款非常适合做日志分析的服务,微软云原生的 LogAnalytics 服务就是基于 Azure Data Explorer 服务构建的,相较于数据源的灵活性,LogAnalytics 对于微软云原生服务作为数据源兼容性更好,对于希望自己灵活构建数据源的小伙班这里我推荐大家使用 Azure Data Explorer 服务,它可以平滑的将你现有的 ELK 技术栈继承过来,它原生支持与 LogStash 的集成,从而可以将各种日志数据源采集到 Azure Data Explorer 中进行分析查询。除此之外 Azure Data Explorer 作为 PaaS 托管服务用户无需关心底层 Infra 的基础构建,并且可以实现平滑的水平扩展满足性能的要求。
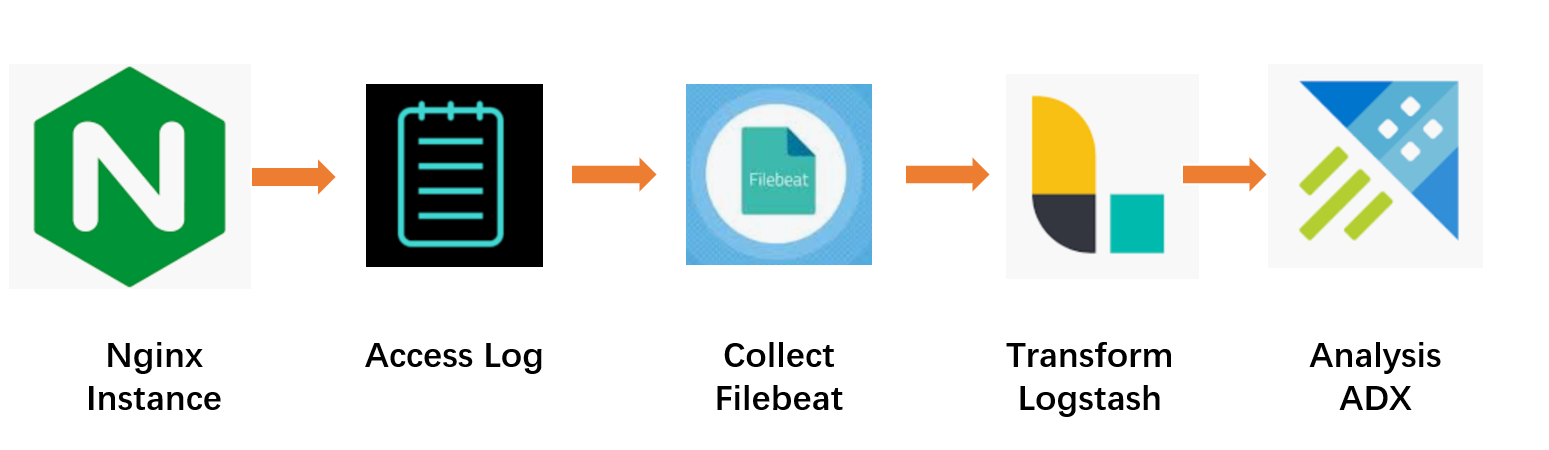
本文以 Nginx 的 Access Log 为例,为大家介绍如何通过 Filebeat + Logstash + Azure Data Explorer 来实现日志收集和分析。架构图参考如下:
Nginx 本文示例中采用 1.16.1 版本,从1.11.8 版本开始 Nginx Access Log 已经原生支持 Json 格式,大家可以参考如下 Nginx 配置文件,对 Access Log 格式进行定义,创建 nginx-log-json.conf
log_format json escape=json '{ '
 '"remote_ip": "$remote_addr", '
 '"user_name": "$remote_user", '
 '"time": "$time_iso8601", '
 '"method": "$request_method", '
 '"nginxhostname": "$host", '
 '"url": "$request_uri", '
 '"http_protocol": "$server_protocol", '
 '"response_code": "$status", '
 '"bytes": "$body_bytes_sent", '
 '"referrer": "$http_referer", '
 '"user_agent": "$http_user_agent" '
'}';
在 nginx.conf 中引用上述配置,在 http 配置章节,引用上述定义,并定义 Access Log 输出路径及格式。
http {

        # Other Config Setting

        ##
        # Logging Settings
        ##

        include nginx-log-json.conf;
        access_log /var/log/nginx/access.json json;
        error_log /var/log/nginx/error.log;

        # Other Config Setting
}
配置 Filebeat 从 Nginx Access Log 路径收集日志,并将日志输入 LogStash 进行 Transform,Filebeat 配置文件如下,其中将 Log 定义中的 path 修改为 Nginx 的 Access Log 文件路径,配置 LogStash 作为输出,本示例中 Logstash 与 Nginx 在相同主机上所以 Logstash 地址为 localhost,如果大家在真实部署时 Logstash 独立部署的话,可以按照实际地址进行修改。
###################### Filebeat Configuration Example #########################

# This file is an example configuration file highlighting only the most common
# options. The filebeat.reference.yml file from the same directory contains all the
# supported options with more comments. You can use it as a reference.
#
# You can find the full configuration reference here:
# https://www.elastic.co/guide/en/beats/filebeat/index.html

# For more available modules and options, please see the filebeat.reference.yml sample
# configuration file.

#=========================== Filebeat inputs =============================

filebeat.inputs:

# Each - is an input. Most options can be set at the input level, so
# you can use different inputs for various configurations.
# Below are the input specific configurations.

- type: log

  # Change to true to enable this input configuration.
  enabled: true

  # Paths that should be crawled and fetched. Glob based paths.
  paths:
    - /var/log/nginx/*.json
    #- c:\programdata\elasticsearch\logs\*

  tags: ["nginx", "json"]

  json:
    keys_under_root: true
    add_error_key: true
  # Exclude lines. A list of regular expressions to match. It drops the lines that are
  # matching any regular expression from the list.
  #exclude_lines: ['^DBG']

  # Include lines. A list of regular expressions to match. It exports the lines that are
  # matching any regular expression from the list.
  #include_lines: ['^ERR', '^WARN']

  # Exclude files. A list of regular expressions to match. Filebeat drops the files that
  # are matching any regular expression from the list. By default, no files are dropped.
  #exclude_files: ['.gz$']

  # Optional additional fields. These fields can be freely picked
  # to add additional information to the crawled log files for filtering
  #fields:
  #  level: debug
  #  review: 1

  ### Multiline options

  # Multiline can be used for log messages spanning multiple lines. This is common
  # for Java Stack Traces or C-Line Continuation

  # The regexp Pattern that has to be matched. The example pattern matches all lines starting with [
  #multiline.pattern: ^\[

  # Defines if the pattern set under pattern should be negated or not. Default is false.
  #multiline.negate: false

  # Match can be set to "after" or "before". It is used to define if lines should be append to a pattern
  # that was (not) matched before or after or as long as a pattern is not matched based on negate.
  # Note: After is the equivalent to previous and before is the equivalent to to next in Logstash
  #multiline.match: after


#============================= Filebeat modules ===============================

filebeat.config.modules:
  # Glob pattern for configuration loading
  path: ${path.config}/modules.d/*.yml

  # Set to true to enable config reloading
  reload.enabled: false

  # Period on which files under path should be checked for changes
  #reload.period: 10s

#==================== Elasticsearch template setting ==========================

#setup.template.settings:
#  index.number_of_shards: 1
  #index.codec: best_compression
  #_source.enabled: false

#================================ General =====================================

# The name of the shipper that publishes the network data. It can be used to group
# all the transactions sent by a single shipper in the web interface.
#name:

# The tags of the shipper are included in their own field with each
# transaction published.
#tags: ["service-X", "web-tier"]

# Optional fields that you can specify to add additional information to the
# output.
#fields:
#  env: staging


#============================== Dashboards =====================================
# These settings control loading the sample dashboards to the Kibana index. Loading
# the dashboards is disabled by default and can be enabled either by setting the
# options here or by using the `setup` command.
#setup.dashboards.enabled: false

# The URL from where to download the dashboards archive. By default this URL
# has a value which is computed based on the Beat name and version. For released
# versions, this URL points to the dashboard archive on the artifacts.elastic.co
# website.
#setup.dashboards.url:

#============================== Kibana =====================================

# Starting with Beats version 6.0.0, the dashboards are loaded via the Kibana API.
# This requires a Kibana endpoint configuration.
#setup.kibana:

  # Kibana Host
  # Scheme and port can be left out and will be set to the default (http and 5601)
  # In case you specify and additional path, the scheme is required: http://localhost:5601/path
  # IPv6 addresses should always be defined as: https://[2001:db8::1]:5601
  #host: "localhost:5601"

  # Kibana Space ID
  # ID of the Kibana Space into which the dashboards should be loaded. By default,
  # the Default Space will be used.
  #space.id:

#============================= Elastic Cloud ==================================

# These settings simplify using Filebeat with the Elastic Cloud (https://cloud.elastic.co/).

# The cloud.id setting overwrites the `output.elasticsearch.hosts` and
# `setup.kibana.host` options.
# You can find the `cloud.id` in the Elastic Cloud web UI.
#cloud.id:

# The cloud.auth setting overwrites the `output.elasticsearch.username` and
# `output.elasticsearch.password` settings. The format is `<user>:<pass>`.
#cloud.auth:

#================================ Outputs =====================================

# Configure what output to use when sending the data collected by the beat.

#-------------------------- Elasticsearch output ------------------------------
#output.elasticsearch:
  # Array of hosts to connect to.
#  hosts: ["localhost:9200"]

  # Optional protocol and basic auth credentials.
  #protocol: "https"
  #username: "elastic"
  #password: "changeme"

#----------------------------- Logstash output --------------------------------
output.logstash:
  # The Logstash hosts
  hosts: ["localhost:5044"]

  # Optional SSL. By default is off.
  # List of root certificates for HTTPS server verifications
  #ssl.certificate_authorities: ["/etc/pki/root/ca.pem"]

  # Certificate for SSL client authentication
  #ssl.certificate: "/etc/pki/client/cert.pem"

  # Client Certificate Key
  #ssl.key: "/etc/pki/client/cert.key"

#================================ Processors =====================================

# Configure processors to enhance or manipulate events generated by the beat.

#processors:
#  - add_host_metadata: ~
#  - add_cloud_metadata: ~

#================================ Logging =====================================

# Sets log level. The default log level is info.
# Available log levels are: error, warning, info, debug
#logging.level: debug

# At debug level, you can selectively enable logging only for some components.
# To enable all selectors use ["*"]. Examples of other selectors are "beat",
# "publish", "service".
#logging.selectors: ["*"]

#============================== X-Pack Monitoring ===============================
# filebeat can export internal metrics to a central Elasticsearch monitoring
# cluster.  This requires xpack monitoring to be enabled in Elasticsearch.  The
# reporting is disabled by default.

# Set to true to enable the monitoring reporter.
#monitoring.enabled: false

# Sets the UUID of the Elasticsearch cluster under which monitoring data for this
# Filebeat instance will appear in the Stack Monitoring UI. If output.elasticsearch
# is enabled, the UUID is derived from the Elasticsearch cluster referenced by output.elasticsearch.
#monitoring.cluster_uuid:

# Uncomment to send the metrics to Elasticsearch. Most settings from the
# Elasticsearch output are accepted here as well.
# Note that the settings should point to your Elasticsearch *monitoring* cluster.
# Any setting that is not set is automatically inherited from the Elasticsearch
# output configuration, so if you have the Elasticsearch output configured such
# that it is pointing to your Elasticsearch monitoring cluster, you can simply
# uncomment the following line.
#monitoring.elasticsearch:

#================================= Migration ==================================
配置 Logstash 进行日志信息的 Transform 并将结果数据输出至 Azure Data Explorer,Logstash 示例配置文件参考如下,其中 input 定义从 Filebeat 读取日志,filer 中通过 grok 从 nginx 访问日志中的 http_protocol 输出中提取 http 版本号码,通过 geoip 插件和 useragent 插件对 nginx 原生日志中的字段进行 transform。output 部分定义 Azure Data Explorer 作为接收方,其中 ingest_url, app_id, app_key, app_tenant, database, table, mapping 字段按照所创建的 azure data explorer 内的信息进行定义。默认 Logstash 中不包含 Azure data explorer 插件,请参考如下文档安装:https://docs.microsoft.com/en-us/azure/data-explorer/ingest-data-logstash
input {
    beats {
        port => "5044"
        codec => json
    }
}
# The filter part of this file is commented out to indicate that it is
# optional.
filter {
    if "nginx" in [tags] {
        # nginx doesn't log the http version, only the protocol.
        # i.e. HTTP/1.1, HTTP/2
        grok {
            match => {
                "[http_protocol]" => "HTTP/%{NUMBER:[http_version]}"
            }
        }
        geoip {
            source => "[remote_ip]"
            target => "[geoip]"
        }
        useragent {
            source => "[user_agent]"
            target => "user_agent_info"
        }

    }
}
output {
    kusto {
            path => "/tmp/kusto/%{+YYYY-MM-dd-HH-mm-ss}.txt"
            ingest_url => "https://ingest-xxx.westus2.kusto.windows.net/"
            app_id => "xxx"  # azure management application identity
            app_key => "xxx"  # azure management application identity password
            app_tenant => "xxx"  # azure tenant id
            database => "nginx"  # database name defined in ADX
            table => "nginxlogs" # table name defined in ADX
            mapping => "basicmsg" # table mapping schema defined in ADX
    }
}
配置 Azure Data Explorer,创建过程这里不再赘述,大家可以自行查阅文档。这里主要为大家介绍上述所引用的 Table 和 Mapping 如何创建,其中 table 是最终在 ADX 中存储 nginx access log 的表,所以需要按照字段类型定义 Schema,Mapping 定义从 LogStash进来的 Json 日志字段如何映射到 ADX 的 Log Table 中。
--- 创建 Table
.create table nginxlogs (remote_ip: string, username: string, accesstime: datetime, method: string, response_code: int, url: string, http_protocol: string, http_version: string, bodybyte: int, referrer: string, user_agent_info: dynamic, geoip: dynamic)
-- 创建 Mapping
.create table nginxlogs ingestion json mapping 'basicmsg' '[{"column":"remote_ip","path":"$.remote_ip"},{"column":"username","path":"$.username"},{"column":"accesstime","path":"$.time"},{"column":"method","path":"$.method"},{"column":"response_code","path":"$.response_code"},{"column":"url","path":"$.url"},{"column":"http_protocol","path":"$.http_protocol"},{"column":"http_version","path":"$.http_version"},{"column":"bodybyte","path":"$.bytes"},{"column":"referrer","path":"$.referrer"},{"column":"user_agent_info","path":"$.user_agent_info"},{"column":"geoip","path":"$.geoip"}]'
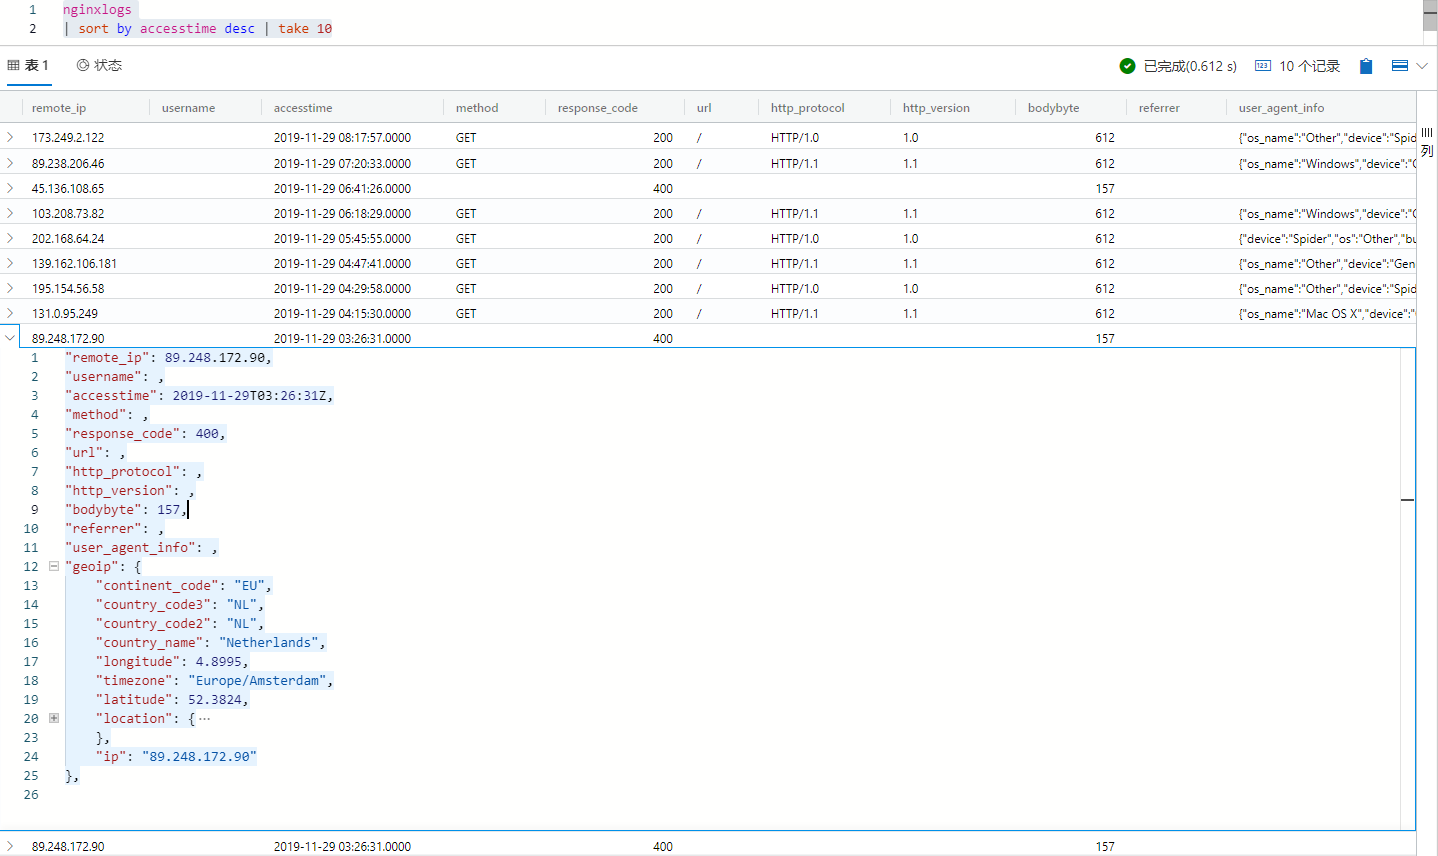
配置完成,我们通过下面简单的 ADX 的 KQL 语言来查询一下所收到的日志
nginxlogs
| sort by accesstime desc | take 10
至此 ADX 日志分析引擎中的日志采集水线已经打通,大家可以通过 ADX 提供的 KQL 查询语言放飞自我了,今天先写到这里下一篇 Blog 我再给大家用 KQL 例举几个简单的查询示例。