Plotly是一款适用于Phython、Java、Matlab等平台的在线绘图程序.
下面,我们从零开始,看看如何用Plotly美化Matlab中的图片!
Step1::
首先,在Plotly官网上注册账号。
Step2:
注册完成后,进入账号设置,可以查看我的API KEY以及USERNAME。
Step3:
接下来,下载matlab端的plotly开源代码。进入如下Github网址后,点击右侧Clone or download即可下载。
https://github.com/plotly/MATLAB-api
Step4:
打开matlab,进入刚下载的文件夹。运行程序
- plotlysetup(‘DemoAccount’, ‘API Key’)
plotlysetup('DemoAccount', 'API Key')其中,DemoAccount与API Key在Step2中已经得到。运行完之后,matlab命令窗中将提示安装成功。此时可以放心地将刚下载的源代码文件夹删除了。
Step5:
我们来画一张图试试。就使用Step3中网址内的Demo。在Matlab命令窗中输入以下代码:
- % Create some data for the two curves to be plotted
- x = 0:0.01:20;
- y1 = 200*exp(-0.05*x).*sin(x);
- y2 = 0.8*exp(-0.5*x).*sin(10*x);
- % Create a plot with 2 y axes using the plotyy function
- figure;
- [ax, h1, h2] = plotyy(x, y1, x, y2, ‘plot’);
- % Add title and x axis label
- xlabel(‘Time (s)’);
- title(‘Frequency Response’);
- % Use the axis handles to set the labels of the y axes
- set(get(ax(1), ‘Ylabel’), ‘String’, ‘Low Frequency’);
- set(get(ax(2), ‘Ylabel’), ‘String’, ‘High Frequency’);
- %–PLOTLY–%
- p = fig2plotly; % <– converts the yy-plot to an interactive, online version.
 % Create some data for the two curves to be plotted
 x  = 0:0.01:20;
 y1 = 200*exp(-0.05*x).*sin(x);
 y2 = 0.8*exp(-0.5*x).*sin(10*x);

 % Create a plot with 2 y axes using the plotyy function
 figure;
 [ax, h1, h2] = plotyy(x, y1, x, y2, 'plot');

 % Add title and x axis label
 xlabel('Time (s)');
 title('Frequency Response');

 % Use the axis handles to set the labels of the y axes
 set(get(ax(1), 'Ylabel'), 'String', 'Low Frequency');
 set(get(ax(2), 'Ylabel'), 'String', 'High Frequency');

 %--PLOTLY--%
 p = fig2plotly; % <-- converts the yy-plot to an interactive, online version.
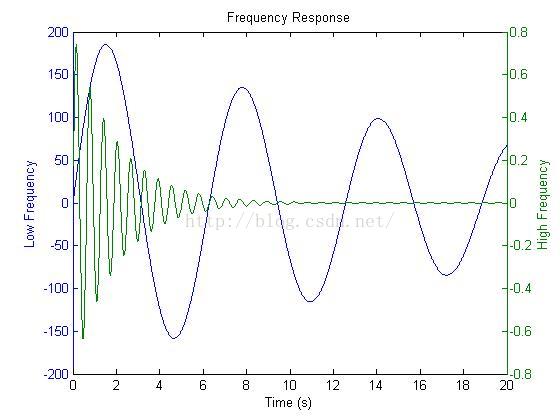
这是一个双纵坐标绘图代码,注意仅有最后一行属于plotly。如果仅靠matlab自带的plotyy函数绘图,效果是这样的:
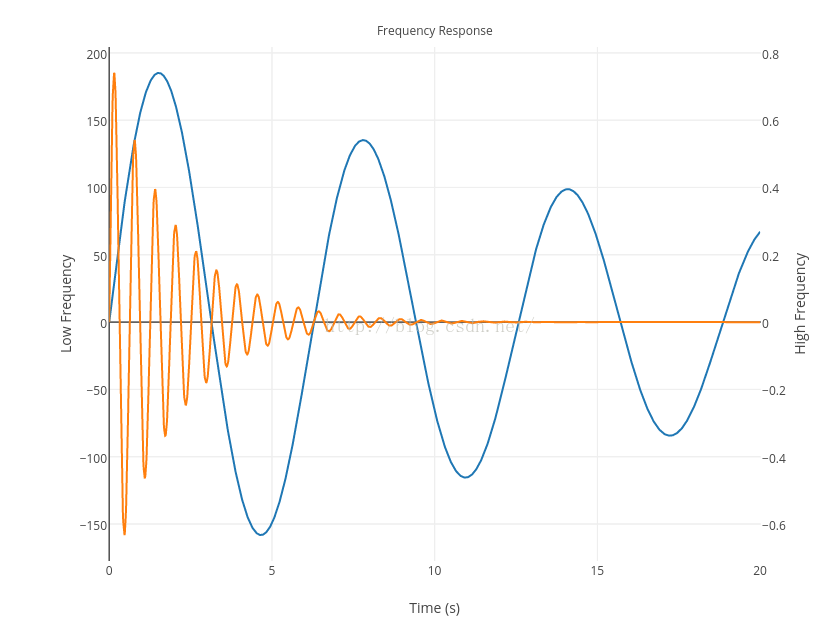
下面我们来查看Plotly绘制的效果。由于Plotly是在线应用程序,因此使用
- <pre name=”code” class=”plain”>p = fig2plotly
<pre name="code" class="plain">p = fig2plotly函数之后,绘制图将默认上传到我们的在线账号上。进入Plotly官网,并登陆账号,进入MyCharts选项卡,即可看到刚才绘制的图片啦。
Step7:
离线绘制图片。
我们可能不希望自己的作图上传到网上,或者有时需要在无网络环境下绘制图片。Plotly支持离线绘图功能。
matlab命令框中输入:
- getplotlyoffline(‘https://cdn.plot.ly/plotly-latest.min.js’)
getplotlyoffline('https://cdn.plot.ly/plotly-latest.min.js')然后,在绘图时,将Step5中的最后一行代码改为:
- p = fig2plotly(gcf,’offline’,true);
p = fig2plotly(gcf,'offline',true);本地就会生成.html格式的图片了,我们可以在浏览器中打开图片,并对其进行编辑。
参考文献:
</div>
Plotly是一款适用于Phython、Java、Matlab等平台的在线绘图程序.
下面,我们从零开始,看看如何用Plotly美化Matlab中的图片!
Step1::
首先,在Plotly官网上注册账号。
Step2:
注册完成后,进入账号设置,可以查看我的API KEY以及USERNAME。
Step3:
接下来,下载matlab端的plotly开源代码。进入如下Github网址后,点击右侧Clone or download即可下载。
https://github.com/plotly/MATLAB-api
Step4:
打开matlab,进入刚下载的文件夹。运行程序
- plotlysetup(‘DemoAccount’, ‘API Key’)
plotlysetup('DemoAccount', 'API Key')其中,DemoAccount与API Key在Step2中已经得到。运行完之后,matlab命令窗中将提示安装成功。此时可以放心地将刚下载的源代码文件夹删除了。
Step5:
我们来画一张图试试。就使用Step3中网址内的Demo。在Matlab命令窗中输入以下代码:
- % Create some data for the two curves to be plotted
- x = 0:0.01:20;
- y1 = 200*exp(-0.05*x).*sin(x);
- y2 = 0.8*exp(-0.5*x).*sin(10*x);
- % Create a plot with 2 y axes using the plotyy function
- figure;
- [ax, h1, h2] = plotyy(x, y1, x, y2, ‘plot’);
- % Add title and x axis label
- xlabel(‘Time (s)’);
- title(‘Frequency Response’);
- % Use the axis handles to set the labels of the y axes
- set(get(ax(1), ‘Ylabel’), ‘String’, ‘Low Frequency’);
- set(get(ax(2), ‘Ylabel’), ‘String’, ‘High Frequency’);
- %–PLOTLY–%
- p = fig2plotly; % <– converts the yy-plot to an interactive, online version.
 % Create some data for the two curves to be plotted
 x  = 0:0.01:20;
 y1 = 200*exp(-0.05*x).*sin(x);
 y2 = 0.8*exp(-0.5*x).*sin(10*x);

 % Create a plot with 2 y axes using the plotyy function
 figure;
 [ax, h1, h2] = plotyy(x, y1, x, y2, 'plot');

 % Add title and x axis label
 xlabel('Time (s)');
 title('Frequency Response');

 % Use the axis handles to set the labels of the y axes
 set(get(ax(1), 'Ylabel'), 'String', 'Low Frequency');
 set(get(ax(2), 'Ylabel'), 'String', 'High Frequency');

 %--PLOTLY--%
 p = fig2plotly; % <-- converts the yy-plot to an interactive, online version.
这是一个双纵坐标绘图代码,注意仅有最后一行属于plotly。如果仅靠matlab自带的plotyy函数绘图,效果是这样的:
下面我们来查看Plotly绘制的效果。由于Plotly是在线应用程序,因此使用
- <pre name=”code” class=”plain”>p = fig2plotly
<pre name="code" class="plain">p = fig2plotly函数之后,绘制图将默认上传到我们的在线账号上。进入Plotly官网,并登陆账号,进入MyCharts选项卡,即可看到刚才绘制的图片啦。
Step7:
离线绘制图片。
我们可能不希望自己的作图上传到网上,或者有时需要在无网络环境下绘制图片。Plotly支持离线绘图功能。
matlab命令框中输入:
- getplotlyoffline(‘https://cdn.plot.ly/plotly-latest.min.js’)
getplotlyoffline('https://cdn.plot.ly/plotly-latest.min.js')然后,在绘图时,将Step5中的最后一行代码改为:
- p = fig2plotly(gcf,’offline’,true);
p = fig2plotly(gcf,'offline',true);本地就会生成.html格式的图片了,我们可以在浏览器中打开图片,并对其进行编辑。
参考文献:
</div>