1. 时间序列基础
import numpy as np
import pandas as pd
np.random.seed(12345)
import matplotlib.pyplot as plt
plt.rc('figure', figsize=(10, 6))
PREVIOUS_MAX_ROWS = pd.options.display.max_rows
pd.options.display.max_rows = 20
np.set_printoptions(precision=4, suppress=True)
pandas最基本的时间序列类型就是以时间戳(通常以Python字符串或datatime对象表示)为索引的Series:
from datetime import datetime

dates = [datetime(2011, 1, 2), datetime(2011, 1, 5),
datetime(2011, 1, 7), datetime(2011, 1, 8),
datetime(2011, 1, 10), datetime(2011, 1, 12)]
ts = pd.Series(np.random.randn(6), index=dates)
ts
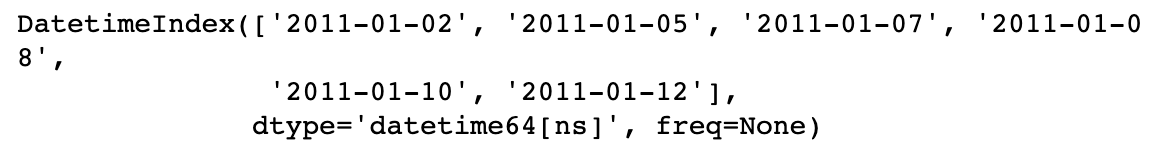
这些datetime对象实际上是被放在一个DatetimeIndex中的:
ts.index
跟其他Series一样,不同索引的时间序列之间的算术运算会自动按日期对 齐:
print(ts[::2]) #每隔一个取一个
ts + ts[::2]
pandas用NumPy的datetime64数据类型以纳秒形式存储时间戳:
ts.index.dtype

DatetimeIndex中的各个标量值是pandas的Timestamp对象:
stamp = ts.index[0]
stamp
只要有需要,TimeStamp可以随时自动转换为datetime对象。此外,它还可以存储频率信息(如果有的话),且知道如何执行时区转换以及其他操作。 之后将对此进行详细讲解。
2. 索引、选取、子集构造
当你根据标签索引选取数据时,时间序列和其它的pandas.Series很像:
print(ts)
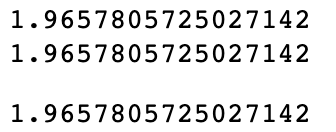
stamp = ts.index[2]
print(ts[stamp]) #标签索引
print(ts[2]) #整数索引
还有一种更为方便的用法:传入一个可以被解释为日期的字符串:
print(ts['1/10/2011'])
print(ts['20110110'])
ts['2011-01-10']
对于较长的时间序列,只需传入“年”或“年月”即可轻松选取数据的切片:
longer_ts = pd.Series(np.random.randn(1000),
index=pd.date_range('1/1/2000', periods=1000))#天为单位
longer_ts
longer_ts['2001']
这里,字符串“2001”被解释成年,并根据它选取时间区间。指定月也同样奏效:
longer_ts['2001-05']
datetime对象也可以进行切片:
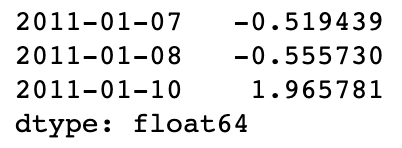
print(ts)
ts[datetime(2011, 1, 7):]
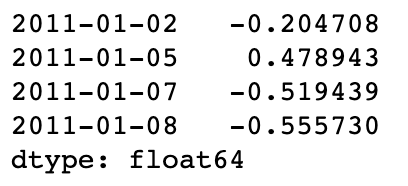
由于大部分时间序列数据都是按照时间先后排序的,因此你也可以用不存在于该时间序列中的时间戳对其进行切片(即范围查询):
ts['1/6/2011':'1/11/2011']
跟之前一样,你可以传入字符串日期、datetime或Timestamp进行索引。注意,这样 切片所产生的是原时间序列的视图(共享内存),跟NumPy数组的切片运算是一样的。
这意味着,没有数据被复制,对切片进行修改会反映到原始数据上。
此外,还有一个等价的实例方法也可以截取两个日期之间TimeSeries:
ts.truncate(after='1/9/2011')无锡妇科医院哪家好 http://www.xasgyy.net/
这些操作对DataFrame也有效。例如,对DataFrame的行进行索引:
dates = pd.date_range('1/1/2000', periods=100, freq='W-WED') #间隔单位为周
long_df = pd.DataFrame(np.random.randn(100, 4),
index=dates,
columns=['Colorado', 'Texas',
'New York', 'Ohio'])
long_df.loc['5-2001']
3. 带有重复索引值的时间序列
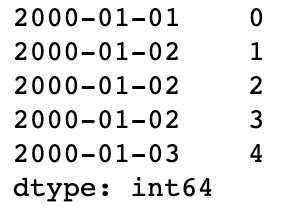
在某些应用场景中,可能会存在多个观测数据落在同一个时间点上的情况。下面就是一个例子:
dates = pd.DatetimeIndex(['1/1/2000', '1/2/2000', '1/2/2000',
'1/2/2000', '1/3/2000'])
dup_ts = pd.Series(np.arange(5), index=dates)
dup_ts
通过检查索引的is_unique属性,我们就可以知道它是不是唯一的:
dup_ts.index.is_unique
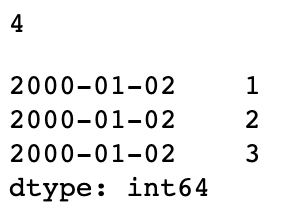
对这个时间序列进行索引,要么产生标量值,要么产生切片,具体要看所选的时间点是否重复:
print(dup_ts['1/3/2000'])# not duplicated
dup_ts['1/2/2000'] # duplicated
假设你想要对具有非唯一时间戳的数据进行聚合。一个办法是使用 groupby,并传入level=0:
grouped = dup_ts.groupby(level=0)
print(grouped.mean())
grouped.count()