1.使用命令查看TCP连接状态
(1)过去常用命令:netstat -antp
[root@ansible-control zabbix]#  netstat -antp
Active Internet connections (servers and established)
Proto Recv-Q Send-Q Local Address           Foreign Address         State       PID/Program name
tcp        0      0 0.0.0.0:10050           0.0.0.0:*               LISTEN      19285/zabbix_agentd
tcp        0      0 0.0.0.0:3306            0.0.0.0:*               LISTEN      1620/mysqld
tcp        0      0 0.0.0.0:111             0.0.0.0:*               LISTEN      815/rpcbind
tcp        0      0 0.0.0.0:80              0.0.0.0:*               LISTEN      7887/nginx: master
tcp        0      0 192.168.122.1:53        0.0.0.0:*               LISTEN      1948/dnsmasq
tcp        0      0 0.0.0.0:22              0.0.0.0:*               LISTEN      1169/sshd
tcp        0      0 127.0.0.1:631           0.0.0.0:*               LISTEN      1171/cupsd
tcp        0      0 127.0.0.1:25            0.0.0.0:*               LISTEN      1691/master
tcp        0      0 127.0.0.1:6010          0.0.0.0:*               LISTEN      12527/sshd: root@pt
tcp        0      0 127.0.0.1:6011          0.0.0.0:*               LISTEN      16970/sshd: root@pt
(2)现在常用命令:ss -antp
[root@ansible-control zabbix]# ss -antp
State      Recv-Q Send-Q      Local Address:Port                     Peer Address:Port
LISTEN     0      128                     *:10050                               *:*                   users:(("zabbix_agentd",pid=19290,fd=4),("zabbix_agentd",pid=19289,fd=4),("zabbix_agentd",pid=19288,fd=4),("zabbix_agentd",pid=19287,fd=4),("zabbix_agentd",pid=19286,fd=4),("zabbix_agentd",pid=19285,fd=4))
LISTEN     0      50                      *:3306                                *:*                   users:(("mysqld",pid=1620,fd=14))
LISTEN     0      128                     *:111                                 *:*                   users:(("rpcbind",pid=815,fd=8))
LISTEN     0      128                     *:80                                  *:*                   users:(("nginx",pid=7888,fd=6),("nginx",pid=7887,fd=6))
LISTEN     0      5           192.168.122.1:53                                  *:*                   users:(("dnsmasq",pid=1948,fd=6))
LISTEN     0      128                     *:22                                  *:*
2.编写监控脚本思路
使用AWK获取第一列的状态信息:
[root@ansible-control zabbix]# ss -antp | awk '{print $1}'
State
LISTEN
LISTEN
LISTEN
LISTEN
LISTEN
LISTEN
LISTEN
LISTEN
LISTEN
LISTEN
TIME-WAIT
TIME-WAIT
TIME-WAIT
3.修改被监控端主机的/etc/zabbix/zabbix_agentd.conf文件
UserParameter=tcp.status[*],ss -antp | awk '{a[$$1]++}END{print a["'$1'"]}'
4.在zabbix-server端测试能够成功获取到客户端信息
[root@zabbix-server-center /]# zabbix_get  -s 192.168.10.100 -p 10050 -k 'tcp.status[LISTEN]'
17
[root@zabbix-server-center /]# zabbix_get  -s 192.168.10.100 -p 10050 -k 'tcp.status[TIME-WAIT]'
96
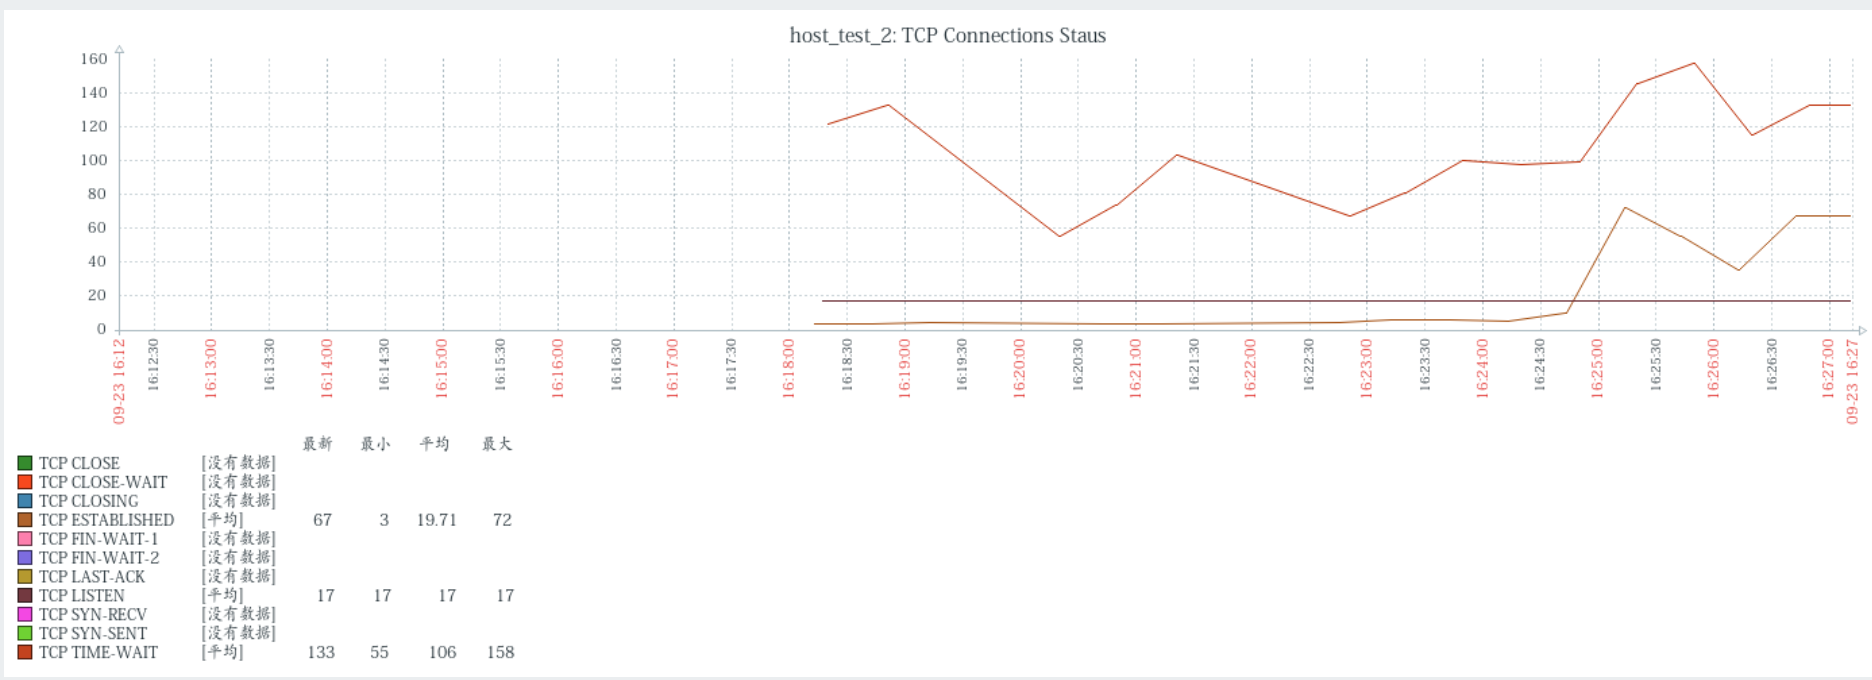
5.创建模板并查看图形