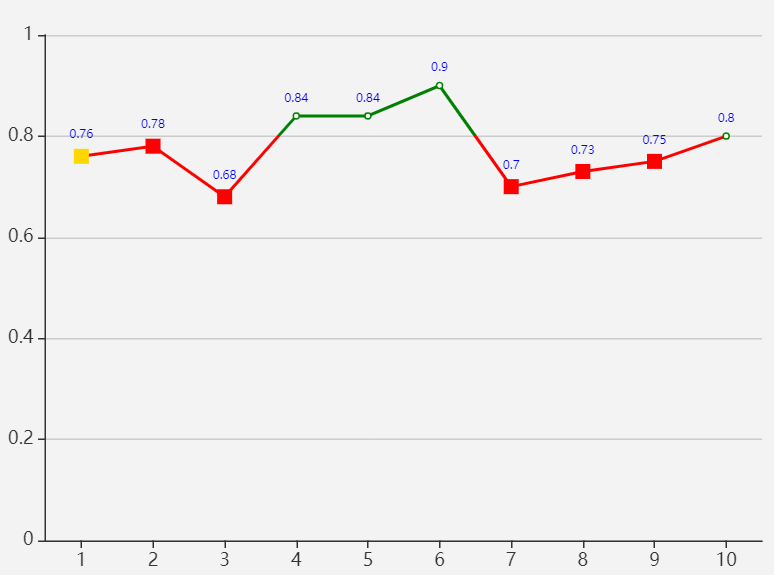
echarts 超出设定范围显示不同的颜色

option = {
    legend: {},
    tooltip: {
        formatter:function(res){
            return res.data.name;
        }
    },
    visualMap: {//区间内控制显示颜色
            top: 10,
            right: 10,
            show: true,
            dimension: 1,
            pieces: [{ min: parseFloat(0.8), max: parseFloat(0.9), color: 'green' }],
            outOfRange: {
                symbol: 'rect', 
                symbolSize: [10, 10],
                color:"red",
            }
        },
    xAxis:{
        data:[1,2,3,4,5,6,7,8,9,10],
        axisTick: { //坐标轴刻度
                alignWithLabel: true,//对其刻度线
                interval: 0,
            },
    },
    yAxis:{},
    series: [
        {
            type: 'line',
            data:[
                {
                    name:"黄色点",
                    value:0.76,
                    visualMap: false,
                    symbol: 'rect', 
                    symbolSize: [10, 10],
                    itemStyle: {
                        normal: {
                            color:"gold",
                        },
                    },
                },
                0.78,
                0.68,
                0.84,
                0.84,
                0.9,
                0.7,
                0.73,
                0.75,
                0.8
                ],
            label: {
                normal: {
                    show: true,
                    position: 'top',
                    formatter: function(pam){
                        return pam.data[1]
                    },
                    color: 'blue',
                    fontSize: 8,
                }
            },
            
        }
    ]
};
猜你喜欢

转载自www.cnblogs.com/xifengmo/p/11512485.html
今日推荐