echarts markLine 辅助线非直线设置

效果图:

用例option:

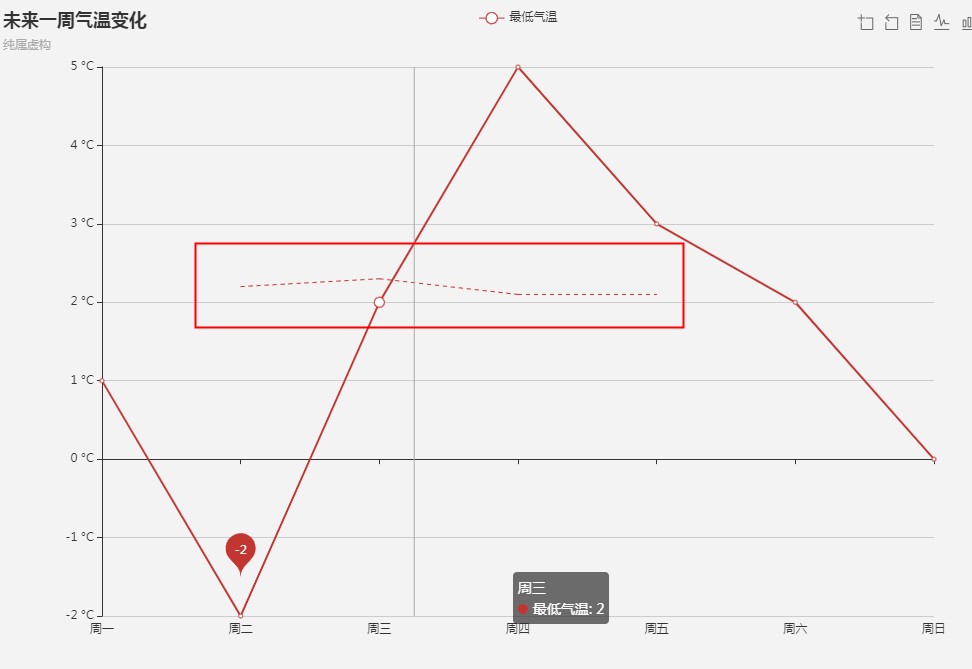
option = {
    title: {
        text: '未来一周气温变化',
        subtext: '纯属虚构'
    },
    tooltip: {
        trigger: 'axis'
    },
    legend: {
        data:['最低气温']
    },
    toolbox: {
        show: true,
        feature: {
            dataZoom: {
                yAxisIndex: 'none'
            },
            dataView: {readOnly: false},
            magicType: {type: ['line', 'bar']},
            restore: {},
            saveAsImage: {}
        }
    },
    xAxis:  {
        type: 'category',
        boundaryGap: false,
        data: ['周一','周二','周三','周四','周五','周六','周日']
    },
    yAxis: {
        type: 'value',
        axisLabel: {
            formatter: '{value} °C'
        }
    },
    series: [
        {
            name:'最低气温',
            type:'line',
            data:[1, -2, 2, 5, 3, 2, 0],
            markPoint: {
                data: [
                    {name: '周最低', value: -2, xAxis: 1, yAxis: -1.5}
                ]
            },
            markLine: { // 非直线设置
                data: [
                    [{
                        symbol: 'none',
                        xAxis: 1,
                        yAxis: 2.2
                    }, {
                        symbol: 'none',
                        xAxis: 2,
                        yAxis: 2.3
                    }],
                    [{
                        symbol: 'none',
                        xAxis: 2,
                        yAxis: 2.3
                    }, {
                        symbol: 'none',
                        xAxis: 3,
                        yAxis: 2.1
                    }],
                    [{
                        symbol: 'none',
                        xAxis: 3,
                        yAxis: 2.1
                    }, {
                        symbol: 'none',
                        xAxis: 4,
                        yAxis: 2.1
                    }]
                ]
            }
        }
    ]
};

不足之处,鼠标悬浮时,线不是连续性高亮

猜你喜欢

转载自www.cnblogs.com/xtreme/p/11460535.html