import numpy as np # linear algebra
import pandas as pd # data processing, CSV file I/O (e.g. pd.read_csv)

# Any results you write to the current directory are saved as output.
import matplotlib.pyplot as plt
import seaborn as sns

%matplotlib inline
path = "F:\\kaggleDataSet\\"
facility_tiers = pd.read_csv(path + os.listdir(path)[1])
facility_tiers.head()

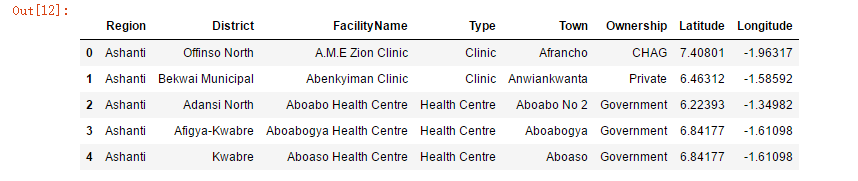
facility_gh = pd.read_csv(path + os.listdir(path)[0])
facility_gh.head()
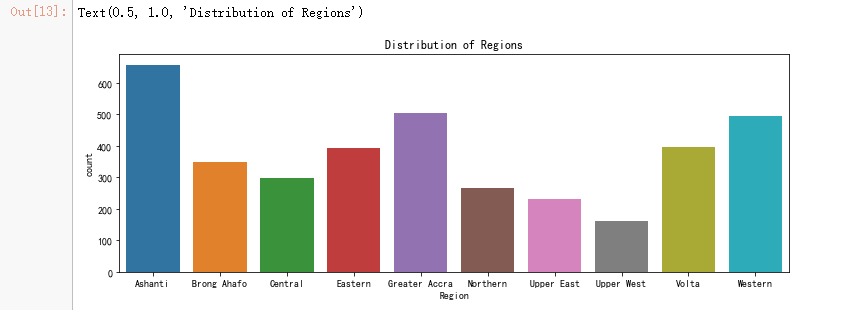
plt.figure(figsize=(12, 4))
ax = sns.countplot(facility_gh['Region'])
plt.title('Distribution of Regions')
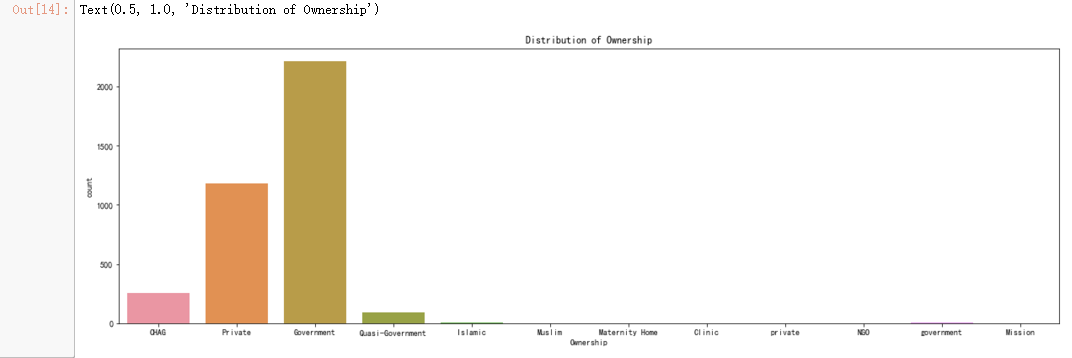
plt.figure(figsize=(20, 6))
ax = sns.countplot(facility_gh['Ownership'])
plt.title('Distribution of Ownership')
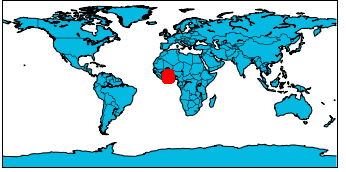
from mpl_toolkits.basemap import Basemap

fig = plt.figure()
m = Basemap(projection='cyl', llcrnrlon=-180, urcrnrlon=180, llcrnrlat=-90, urcrnrlat=90, resolution='c',lat_ts=True)
m.drawcoastlines()
m.fillcontinents(color='#04BAE3', lake_color='#FFFFFF')
m.drawcountries()
m.drawmapboundary(fill_color='#FFFFFF')

mloc = m(facility_gh['Latitude'].tolist(), facility_gh['Longitude'].tolist())
m.scatter(mloc[1], mloc[0], color='red', lw=3, alpha=0.3, zorder=5)