2019年7月3日10:49:10
(¦3[▓▓] 晚安
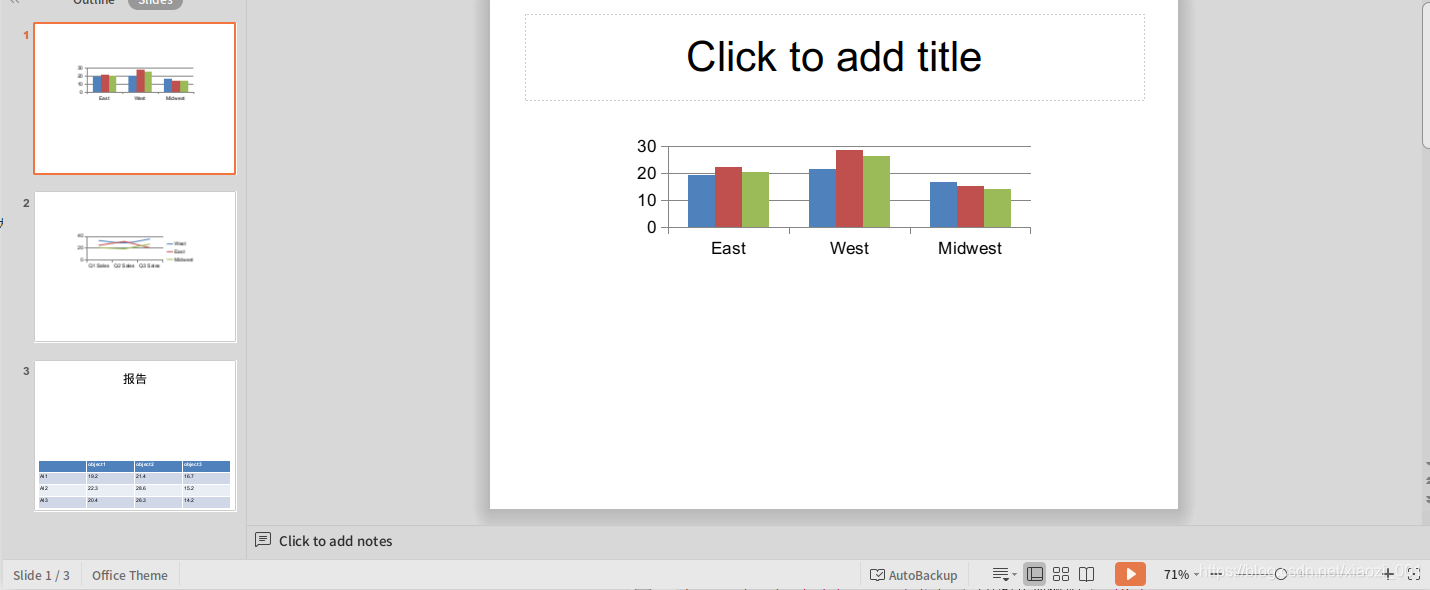
python 在 word ppt pdf 生成折线图、柱状图、饼状图,这里是ppt的操作。环境
python 3.6
python-pptx (pip install python-pptx)
# 使用说明
1、新建demo_pptx.py 2、复制以下代码到py文件中 3、python demo_pptx.py 运行即可生成pptx文件
demo_pptx.py代码如下:
from pptx import Presentation
from pptx.chart.data import CategoryChartData, ChartData
from pptx.enum.chart import XL_CHART_TYPE
from pptx.util import Inches, Cm
from pptx.enum.chart import XL_TICK_MARK
from pptx.util import Pt
from pptx.dml.color import RGBColor

prs = Presentation()
slide = prs.slides.add_slide(prs.slide_layouts[5])

# 柱状图
chart_data = ChartData()
chart_data.categories = ['East', 'West', 'Midwest']
chart_data.add_series('Q1 Sales', (19.2, 21.4, 16.7))
chart_data.add_series('Q2 Sales', (22.3, 28.6, 15.2))
chart_data.add_series('Q3 Sales', (20.4, 26.3, 14.2))

x, y, cx, cy = Inches(2), Inches(2), Inches(6), Inches(2)
graphic_frame = slide.shapes.add_chart(
    XL_CHART_TYPE.COLUMN_CLUSTERED, x, y, cx, cy, chart_data
)

chart = graphic_frame.chart

# 添加第二页 折线图
slide = prs.slides.add_slide(prs.slide_layouts[5])
chart_data = ChartData()
chart_data.categories = ['Q1 Sales', 'Q2 Sales', 'Q3 Sales']
chart_data.add_series('West', (32.2, 28.4, 34.7))
chart_data.add_series('East', (24.3, 30.6, 20.2))
chart_data.add_series('Midwest', (20.4, 18.3, 26.2))

x, y, cx, cy = Inches(2), Inches(2), Inches(6), Inches(2)
chart = slide.shapes.add_chart(
    XL_CHART_TYPE.LINE, x, y, cx, cy, chart_data
).chart

chart.has_legend = True
chart.legend.include_in_layout = False
chart.series[0].smooth = True

# 添加第三页 表格
slide = prs.slides.add_slide(prs.slide_layouts[5])
shapes = slide.shapes

shapes.title.text = '报告'

# 定义表格数据 ------
name_objects = ["object1", "object2", "object3"]
name_AIs = ["AI1", "AI2", "AI3"]
val_AI1 = (19.2, 21.4, 16.7)
val_AI2 = (22.3, 28.6, 15.2)
val_AI3 = (20.4, 26.3, 14.2)
val_AIs = [val_AI1, val_AI2, val_AI3]

# 表格样式 --------------------
rows = 4
cols = 4
top = Cm(12.5)
left = Cm(0.5)  # Inches(2.0)
width = Cm(24)  # Inches(6.0)
height = Cm(6)  # Inches(0.8)

# 添加表格到幻灯片 --------------------
table = shapes.add_table(rows, cols, left, top, width, height).table

# 设置单元格宽度
table.columns[0].width = Cm(6)  # Inches(2.0)
table.columns[1].width = Cm(6)
table.columns[2].width = Cm(6)
table.columns[3].width = Cm(6)

# 设置标题行
table.cell(0, 1).text = name_objects[0]
table.cell(0, 2).text = name_objects[1]
table.cell(0, 3).text = name_objects[2]

# 填充数据
table.cell(1, 0).text = name_AIs[0]
table.cell(1, 1).text = str(val_AI1[0])
table.cell(1, 2).text = str(val_AI1[1])
table.cell(1, 3).text = str(val_AI1[2])

table.cell(2, 0).text = name_AIs[1]
table.cell(2, 1).text = str(val_AI2[0])
table.cell(2, 2).text = str(val_AI2[1])
table.cell(2, 3).text = str(val_AI2[2])

table.cell(3, 0).text = name_AIs[2]
table.cell(3, 1).text = str(val_AI3[0])
table.cell(3, 2).text = str(val_AI3[1])
table.cell(3, 3).text = str(val_AI3[2])

prs.save('demo.pptx')
输出如下
参考文献:
官方文档:https://python-pptx.readthedocs.io/en/latest/user/charts.html有什么问题欢迎随时讨论