VC# + GDI+ 绘制


using System;
using System.Collections.Generic;
using System.ComponentModel;
using System.Data;
using System.Drawing;
using System.Linq;
using System.Text;
using System.Threading.Tasks;
using System.Windows.Forms;

namespace WindowsFormsApplication1
{
    public partial class Form1 : Form
    {
        public Form1()
        {
            InitializeComponent();
        }

        private void Form1_Paint(object sender, PaintEventArgs e)
        {
            Graphics g = e.Graphics;


            //Pen pen = new Pen(Color.Red, 5);
            //Point point1 = new Point(10, 50);
            //Point point2 = new Point(100, 50);
            //g.DrawLine(pen, point1, point2);

            //Pen pen1 = new Pen(Color.Black, 3);
            //Point point3 = new Point(150, 30);
            //Point point4 = new Point(150, 100);
            //g.DrawLine(pen1, point3, point4);


            // Draw ellipse to screen.
            Pen pen = new Pen(Color.Gray, 5);
            Brush brush = new SolidBrush(Color.Gray);

            e.Graphics.DrawEllipse(pen, 100, 200, 30, 30);
            e.Graphics.FillEllipse(brush, 100, 200, 30, 30);

            e.Graphics.DrawEllipse(pen, 200, 200, 30, 30);
            e.Graphics.FillEllipse(brush, 200, 200, 30, 30);

            e.Graphics.DrawEllipse(pen, 300, 200, 30, 30);
            e.Graphics.FillEllipse(brush, 300, 200, 30, 30);

            e.Graphics.DrawLine(pen, 100+15, 200+15, 200 + 15, 200 + 15);


        }
    }
}

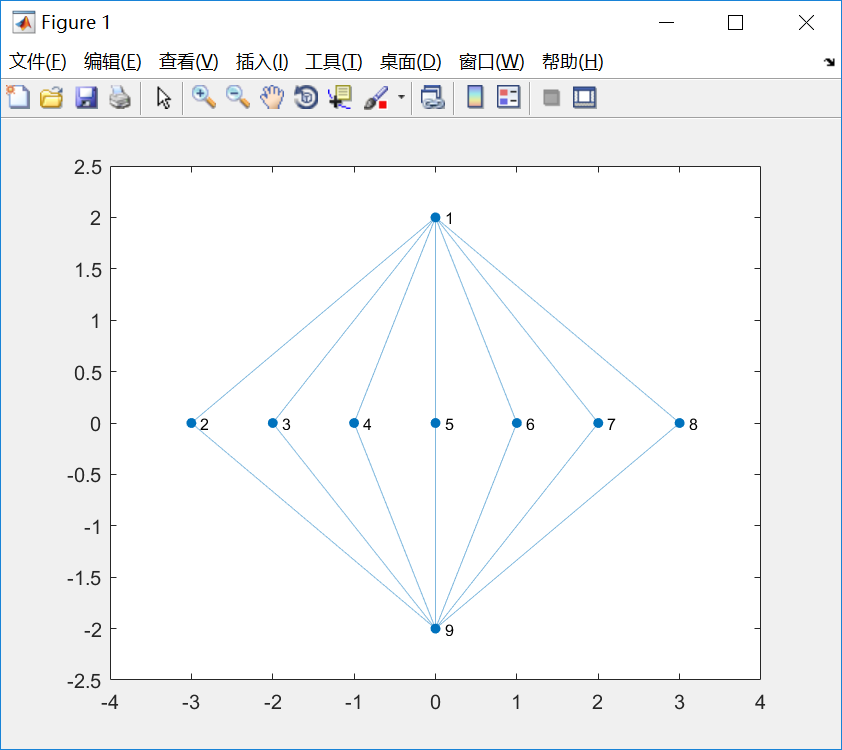
Matlab,使用graph的plot,可以设定点的位置,相对简单些
clc; clear;
s = [1 1 1 1 1 1 1 9 9 9 9 9 9 9];
t = [2 3 4 5 6 7 8 2 3 4 5 6 7 8];
G = graph(s,t);
h = plot(G)
h.XData = [0 -3 -2 -1 0 1 2 3 0];
h.YData = [2 0 0 0 0 0 0 0 -2];
调整节点位置,利用pause制作动画
clc; clear;
s = [1 1 2 4 5 6 1 2 3];
t = [2 3 3 7 8 9 4 5 6];
G = graph(s,t);
h = plot(G)
h.XData = [0 -1 1 -1  0  1 -1  0  1];
h.YData = [2  1 1 -1 -1 -1 -2 -2 -2];
h.LineWidth = 3;
h.MarkerSize = 8;

pause(0.2)

s = [1 1 2 4 5 6 1 2 3];
t = [2 3 3 7 8 9 5 4 6];
G = graph(s,t);
h = plot(G)
h.XData = [0 -1 1 -1  0  1 -1  0  1];
h.YData = [2  1 1 -1 -1 -1 -2 -2 -2];
h.LineWidth = 3;
h.MarkerSize = 8;

pause(0.5)

s = [1 1 2 4 5 6 1 2 3];
t = [2 3 3 7 8 9 6 5 4];
G = graph(s,t);
h = plot(G)
h.XData = [0 -1 1 -1  0  1 -1  0  1];
h.YData = [2  1 1 -1 -1 -1 -2 -2 -2];
h.LineWidth = 3;
h.MarkerSize = 8;

这儿有一个如何利用matlab制作gif图的教程。