memcheck
内存泄露是线上很严重也是比较常见的故障,内存泄漏问题,一般可以用memcheck工具来检查。
http://valgrind.org/docs/manual/mc-manual.html
Memcheck是一个内存错误检测器。它可以检测C和C ++程序中常见的以下问题。
-
访问内存不应该,例如超越和不足堆积块,超出堆栈顶部,并在释放后访问内存。
-
使用未定义的值,即尚未初始化的值,或从其他未定义值派生的值。
-
堆存储器的不正确释放,如双释放堆块,或错配的使用
malloc/new/new[]与free/delete/delete[] -
重叠
src和dst指针memcpy以及相关功能。 -
将一个可疑(可能为负)值传递
size给内存分配函数的 参数。 -
内存泄漏。
像这样的问题很难通过其他方式找到,经常长时间未被发现,然后导致偶尔的,难以诊断的崩溃。
但是有时候memcheck工具查了没泄漏,程序一跑,内存还是狂飙。这又是什么问题。。。
其实memcheck检查的内存泄漏只是狭义的内存泄漏,或者说是严格的内存泄漏,也就是说,在程序运行的生命周期内,这部分内存你是彻底释放不了了,即,你失去了这些地址。
其实还有第二种类型的内存泄漏,就是,长期闲置的内存堆积。这部分内存虽然你还保存了地址,想要释放的时候还是能释放。关键就是你忘了释放。。。杯具啊。这种问题memcheck就不给力了。
这就引出了第二个内存工具valgrind –tool=massif。
会产生massif.out.****的文件,然后使用
# ms_print massif.out.*** >massif.log
massif 可以的帮我们发现很多问题,比如现实中总是遇到一些内存一直上涨,可以就是没有memory leaker的情况, 其实这样的情况并不奇怪,非常容易发生,比如每次循环的时候你并没有把上次的内存释放,同时不断在后面添加更多的内容,这显然不会有memory leaker,倒是到了一定的程度,自然会发生bad alloc的问题。对于这样的问题massif就可以大显身手,比较一下两个内存的切片,增加的部分自然就发现了。
官方主页教程:http://valgrind.org/docs/manual/ms-manual.html
概观
Massif是一个堆分析器。它测量程序使用的堆内存量。这包括有用空间和为记账和对齐目的分配的额外字节。它也可以测量程序堆栈的大小,但默认情况下不会这样做。
堆分析可以帮助您减少程序使用的内存量。在具有虚拟内存的现代机器上,这提供了以下好处:
-
它可以加速您的程序 - 较小的程序将更好地与您的机器的缓存进行交互,并避免分页。
-
如果你的程序使用大量内存,它将减少耗尽机器交换空间的机会。
此外,传统的泄漏检查器(例如Memcheck)也没有检测到某些空间泄漏。这是因为内存实际上并没有丢失 - 指针仍然存在 - 但它没有被使用。像这样泄漏的程序可能会不必要地增加它们随时间使用的内存量。Massif可以帮助识别这些泄漏。
重要的是,Massif不仅会告诉您程序正在使用多少堆内存,还会提供非常详细的信息,指示程序的哪些部分负责分配堆内存。
Massif还使用命令行选项和monitor命令 提供执行树内存分析。--xtree-memoryxtmemory
使用Massif和ms_print
首先,对于其他Valgrind工具,您应该使用调试信息(-g选项)进行编译。编译程序的优化级别并不重要,因为这不太可能影响堆内存使用。
然后,您需要运行Massif本身来收集分析信息,然后运行ms_print以可读的方式呈现它。
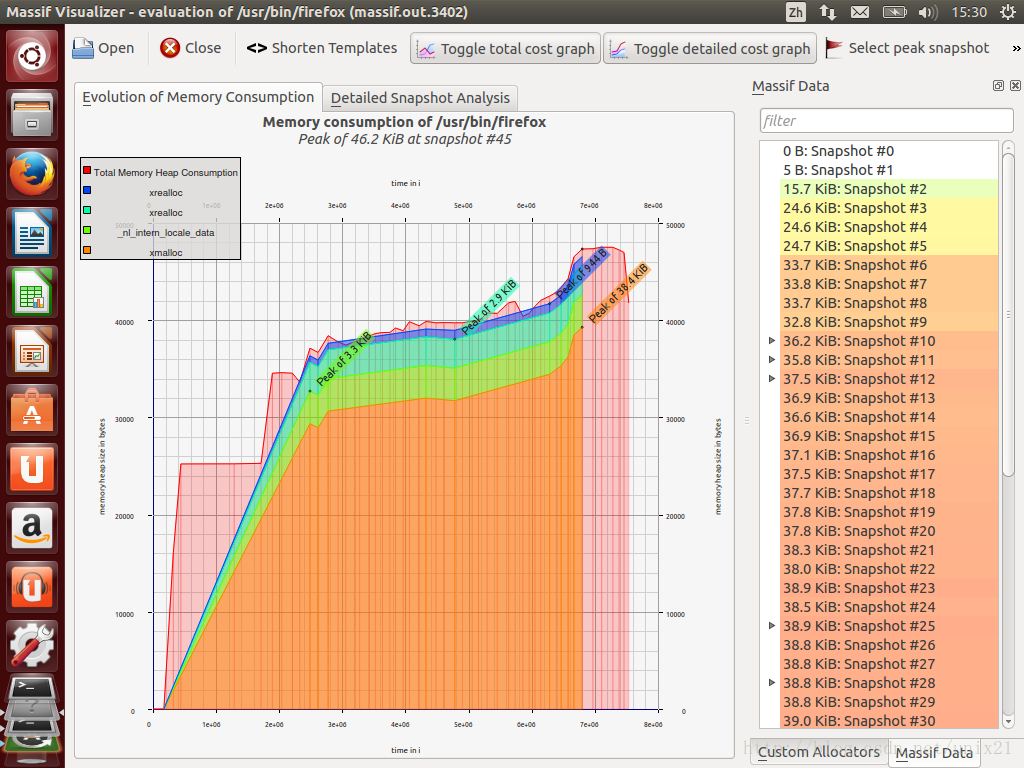
先看一个图是分析firefox内存使用的:

安装massif-visualizer
massif-visualizer是ubuntu下的图形化分析工具
http://get.ubuntusoft.com/app/massif-visualizer
项目主页:
https://projects.kde.org/projects/extragear/sdk/massif-visualizer
massif-visualizer下载:
http://tel.mirrors.163.com/ubuntu/pool/universe/m/massif-visualizer/
软件包详细信息:
http://packages.ubuntu.com/massif-visualizer
安装massif-visualizer:

官方示例代码:
#include <stdlib.h>

void g(void){
	malloc(4000);
}

void f(void){
	malloc(2000);
	g();
}

int main(void){
	int i;
	int* a[10];

	for(i = 0; i < 10; i++){
	a[i] = malloc(1000);
	}

	f();
	g();

	for(i = 0; i < 10; i++){
	free(a[i]);
	}

	return 0;
}
# cc -o test test.c
# valgrind --tool=massif ./test
# ms_print massif.out.4144

Why is most of the graph empty, with only a couple of bars at the veryend? By default, Massif uses "instructions executed" as the unit of time.For very short-run programs such as the example, most of the executedinstructions involve the loading and dynamic linking of the program. Theexecution of main (and thus the heapallocations) only occur at the very end. For a short-running program likethis, we can use the--time-unit=B optionto specify that we want the time unit to instead be the number of bytesallocated/deallocated on the heap and stack(s).
If we re-run the program under Massif with this option, and thenre-run ms_print, we get this more useful graph:

在massif-visualizer下看图形化的:massif.out.4144

在massif-visualizer下看图形化的:massif.out.4164

再看这个C++程序:
#include <stdlib.h>
#include <stdio.h>

int *fa()
{
  int *p=(int*)malloc(10000);
  return p;
}

int *fb(int *p)
{
  delete p;
}

int main(void)
{
  printf("ok\n");

  printf("really ok?\n");

  int *vec[10000];

  for(int i=0;i<10000;i++)
  {
    vec[i]=fa();
  }


  for(int i=0;i<10000;i++)
  {
    fb(vec[i]);
  }

  return 0;
}
# g++ test.cc -o testcpp

监控nginx,redis,memcached
# valgrind --tool=massif /usr/local/nginx/sbin/nginx -c /usr/local/nginx/conf/nginx.conf
# valgrind --tool=massif /usr/local/memcached/bin/memcached -d -m 64 -uroot -l 0.0.0.0 -p 11211 -c 1024
# valgrind --tool=massif /usr/redis-2.8.1/src/redis-server
redis:

memcached:

nginx:

安装一个插件可以看到函数调用关系:

firefox:


-----------------------------------------------------------------------------
非常好的使用实例:
Memory profiling Firefox with Massif
http://blog.mozilla.org/nnethercote/2010/12/09/memory-profiling-firefox-with-massif/
Here’s the command line I used:
  valgrind --smc-check=all --trace-children=yes --tool=massif --pages-as-heap=yes \
    --detailed-freq=1000000 optg64/dist/bin/firefox -P cad20 -no-remote
Here’s what that means:
--smc-check=alltells Valgrind that the program may use self-modifying code (or, in Firefox’s case, overwrite dynamically generated code).--trace-childrentells Valgrind to trace into child processes exec’d by the program. This is necessary because optg64/dist/bin/firefox is a wrapper script.--tool=massiftells Valgrind to run Massif.--pages-as-heap=yestells Massif to profile allocations of all memory at the page level, rather than just profiling the heap (ie. memory allocated via malloc/new). This is important because the heap is less than half of Firefox’s memory consumption.--detailed-freq=1000000tells Massif to do detailed snapshots (which are more informative but more costly) only every 1,000,000th snapshot, which is less often than the default of every 10th snapshot. This makes it run a bit faster. This is fine because Massif always takes a detailed snapshot at the peak memory consumption point, and that’s the one I’m interested in.optg64/is the name of my build directory.-P cad20tells Firefox to use a particular profile that I set up appropriately.-no-remotetells Firefox to start a new instance; this is necessary because I had a Firefox 3.6 process already running.
ms_print massif.out.22722
更多参考:http://www.cs.washington.edu/education/courses/cse326/05wi/valgrind-doc/ms_main.html
