概要
每次用 Matlab 绘图都要搜一堆资料设置一些参数,本次将绘图中的一些参数设置实例展示在这里,以备不时之需。暂包括折线图,面积图。
折线图实例
下图是效果图:
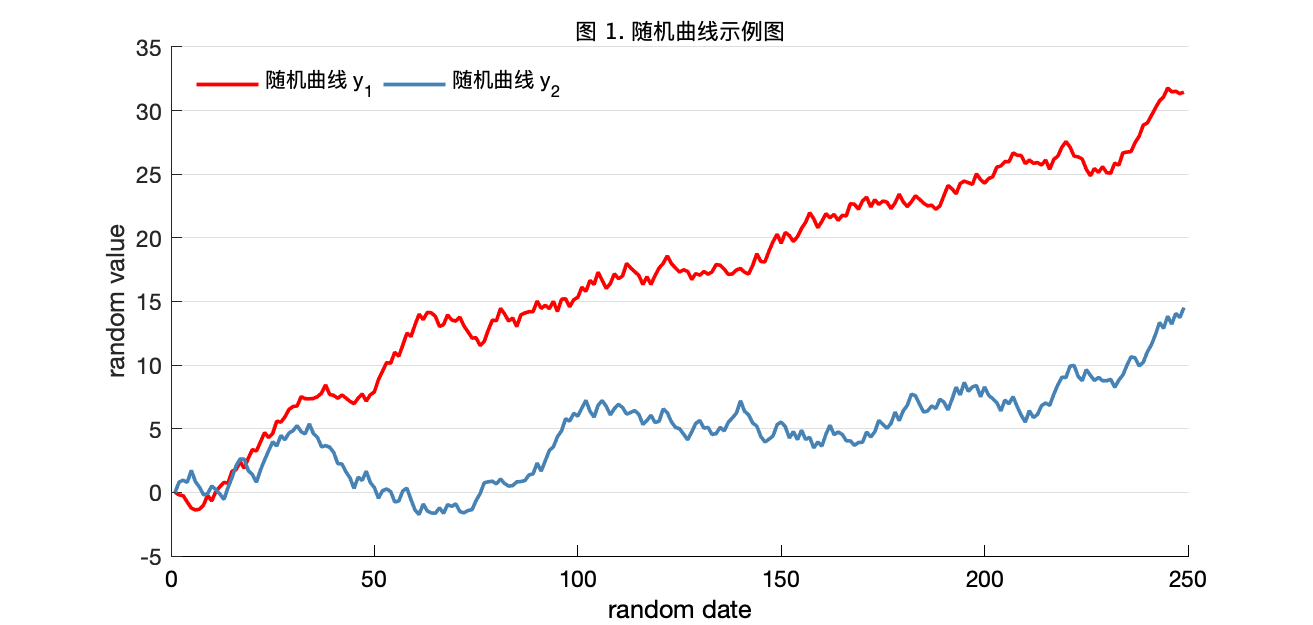
图 1:折线图效果图
Matlab 代码如下:
clc;clear;
y1 = 0; y2 = 0;
len = 249;
for i = 2:len
    y1(i) = y1(i-1) + unifrnd(-0.8,1);
end
for i = 2:len
    y2(i) = y2(i-1) + unifrnd(-0.9,1);
end

figure;

plot( y1, 'linewidth', 1.75, 'Color', 'red')

hold on;
plot(y2, 'linewidth', 1.75, 'Color', [0.27451, 0.5098, 0.70588])
set(gca, 'YGrid', 'on')
set(gca, 'XColor', 'k')
set(gcf,'Position',[10 10 630 300]); %[left,top,width,height]
box off; %去掉坐标的边框
ylabel('random value');
xlabel('random date');
xtickangle(0); % x 轴标签旋转

h = legend('随机曲线 y_1', '随机曲线 y_2', 'Location', 'northwest', 'Orientation', 'horizontal');
set(h, 'Box', 'off'); % 去掉图例边框
title('图 1. 随机曲线示例图', 'FontSize', 10.5, 'FontWeight', 'normal', 'FontName', 'heiti');
saveas(gcf, 'Fig1.png'); % 保存图片到本地
面积图实例
下图是效果图:

图 2:面积图效果图
Matlab 代码如下:
clc;clear;
x = 0:0.1:6*pi;
y1 = sin(x); y2 = sin(x);

y1(y1<0) = 0;
y2(y2>0) = 0;

figure;

h = area([y1',y2'], 'linewidth', 0.05); % 按列绘图的
h(1).FaceColor = [0.2,0.8,0.2];%[0.27451, 0.5098, 0.70588]; % 指定第一列填充颜色
h(2).FaceColor = [1, 0.55, 0]; % 指定第二列填充颜色
h(1).EdgeAlpha = 0; % 将边线设置为透明,0 到 1 之间
h(2).EdgeAlpha = 0; % 将边线设置为透明,0 到 1 之间

set(gca, 'YLim', [-1.2, 1.5]); % 设置 Y 轴显示范围
set(gca, 'YGrid', 'on');
set(gcf,'Position',[10 10 630 300]); %[left,top,width,height]
box off; %去掉坐标的边框
ylabel('sin value');
xlabel('x value');

h = legend('余弦曲线(正)', '余弦曲线(负)', 'Location', 'northwest', 'Orientation', 'horizontal');
set(h, 'Box', 'off'); % 去掉图例边框
title('图 2. 面积图示例', 'FontSize', 10.5, 'FontWeight', 'normal', 'FontName', 'heiti');
saveas(gcf, 'Fig2.png'); % 保存图片到本地