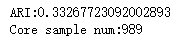
import numpy as np
import matplotlib.pyplot as plt

from sklearn import  cluster
from sklearn.metrics import adjusted_rand_score
from sklearn.datasets.samples_generator import make_blobs

def create_data(centers,num=100,std=0.7):
    X, labels_true = make_blobs(n_samples=num, centers=centers, cluster_std=std)
    return  X,labels_true

#密度聚类DBSCAN模型
def test_DBSCAN(*data):
    X,labels_true=data
    clst=cluster.DBSCAN()
    predicted_labels=clst.fit_predict(X)
    print("ARI:%s"% adjusted_rand_score(labels_true,predicted_labels))
    print("Core sample num:%d"%len(clst.core_sample_indices_))

# 用于产生聚类的中心点
centers=[[1,1],[2,2],[1,2],[10,20]]
# 产生用于聚类的数据集
X,labels_true=create_data(centers,1000,0.5)
#  调用 test_DBSCAN 函数
test_DBSCAN(X,labels_true)
def test_DBSCAN_epsilon(*data):
    '''
    测试 DBSCAN 的聚类结果随  eps 参数的影响
    '''
    X,labels_true=data
    epsilons=np.logspace(-1,1.5)
    ARIs=[]
    Core_nums=[]
    for epsilon in epsilons:
        clst=cluster.DBSCAN(eps=epsilon)
        predicted_labels=clst.fit_predict(X)
        ARIs.append( adjusted_rand_score(labels_true,predicted_labels))
        Core_nums.append(len(clst.core_sample_indices_))
    ## 绘图
    fig=plt.figure()
    ax=fig.add_subplot(1,2,1)
    ax.plot(epsilons,ARIs,marker='+')
    ax.set_xscale('log')
    ax.set_xlabel(r"$\epsilon$")
    ax.set_ylim(0,1)
    ax.set_ylabel('ARI')

    ax=fig.add_subplot(1,2,2)
    ax.plot(epsilons,Core_nums,marker='o')
    ax.set_xscale('log')
    ax.set_xlabel(r"$\epsilon$")
    ax.set_ylabel('Core_Nums')

    fig.suptitle("DBSCAN")
    plt.show()

#  调用 test_DBSCAN_epsilon 函数
test_DBSCAN_epsilon(X,labels_true)

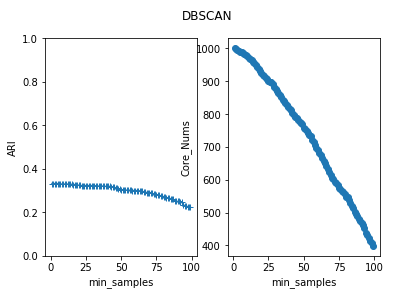
def test_DBSCAN_min_samples(*data):
    '''
    测试 DBSCAN 的聚类结果随  min_samples 参数的影响
    '''
    X,labels_true=data
    min_samples=range(1,100)
    ARIs=[]
    Core_nums=[]
    for num in min_samples:
        clst=cluster.DBSCAN(min_samples=num)
        predicted_labels=clst.fit_predict(X)
        ARIs.append( adjusted_rand_score(labels_true,predicted_labels))
        Core_nums.append(len(clst.core_sample_indices_))

    ## 绘图
    fig=plt.figure()
    ax=fig.add_subplot(1,2,1)
    ax.plot(min_samples,ARIs,marker='+')
    ax.set_xlabel( "min_samples")
    ax.set_ylim(0,1)
    ax.set_ylabel('ARI')

    ax=fig.add_subplot(1,2,2)
    ax.plot(min_samples,Core_nums,marker='o')
    ax.set_xlabel( "min_samples")
    ax.set_ylabel('Core_Nums')

    fig.suptitle("DBSCAN")
    plt.show()

#  调用 test_DBSCAN_min_samples 函数
test_DBSCAN_min_samples(X,labels_true)