import numpy as np
import  matplotlib.pyplot as plt

from sklearn import datasets,naive_bayes
from sklearn.model_selection import train_test_split

# 加载 scikit-learn 自带的 digits 数据集
def load_data():
    '''
    加载用于分类问题的数据集。这里使用 scikit-learn 自带的 digits 数据集
    '''
    digits=datasets.load_digits()
    return train_test_split(digits.data,digits.target,test_size=0.25,random_state=0,stratify=digits.target)

#伯努利贝叶斯BernoulliNB模型
def test_BernoulliNB(*data):
    X_train,X_test,y_train,y_test=data
    cls=naive_bayes.BernoulliNB()
    cls.fit(X_train,y_train)
    print('Training Score: %.2f' % cls.score(X_train,y_train))
    print('Testing Score: %.2f' % cls.score(X_test, y_test))

# 产生用于分类问题的数据集
X_train,X_test,y_train,y_test=load_data()
# 调用 test_BernoulliNB
test_BernoulliNB(X_train,X_test,y_train,y_test)
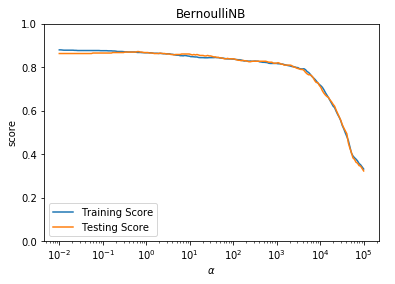
def test_BernoulliNB_alpha(*data):
    '''
    测试 BernoulliNB 的预测性能随 alpha 参数的影响
    '''
    X_train,X_test,y_train,y_test=data
    alphas=np.logspace(-2,5,num=200)
    train_scores=[]
    test_scores=[]
    for alpha in alphas:
        cls=naive_bayes.BernoulliNB(alpha=alpha)
        cls.fit(X_train,y_train)
        train_scores.append(cls.score(X_train,y_train))
        test_scores.append(cls.score(X_test, y_test))

    ## 绘图
    fig=plt.figure()
    ax=fig.add_subplot(1,1,1)
    ax.plot(alphas,train_scores,label="Training Score")
    ax.plot(alphas,test_scores,label="Testing Score")
    ax.set_xlabel(r"$\alpha$")
    ax.set_ylabel("score")
    ax.set_ylim(0,1.0)
    ax.set_title("BernoulliNB")
    ax.set_xscale("log")
    ax.legend(loc="best")
    plt.show()

# 调用 test_BernoulliNB_alpha
test_BernoulliNB_alpha(X_train,X_test,y_train,y_test)
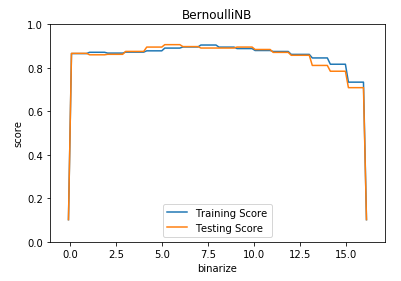
def test_BernoulliNB_binarize(*data):
    '''
    测试 BernoulliNB 的预测性能随 binarize 参数的影响
    '''
    X_train,X_test,y_train,y_test=data
    min_x=min(np.min(X_train.ravel()),np.min(X_test.ravel()))-0.1
    max_x=max(np.max(X_train.ravel()),np.max(X_test.ravel()))+0.1
    binarizes=np.linspace(min_x,max_x,endpoint=True,num=100)
    train_scores=[]
    test_scores=[]
    for binarize in binarizes:
        cls=naive_bayes.BernoulliNB(binarize=binarize)
        cls.fit(X_train,y_train)
        train_scores.append(cls.score(X_train,y_train))
        test_scores.append(cls.score(X_test, y_test))

    ## 绘图
    fig=plt.figure()
    ax=fig.add_subplot(1,1,1)
    ax.plot(binarizes,train_scores,label="Training Score")
    ax.plot(binarizes,test_scores,label="Testing Score")
    ax.set_xlabel("binarize")
    ax.set_ylabel("score")
    ax.set_ylim(0,1.0)
    ax.set_xlim(min_x-1,max_x+1)
    ax.set_title("BernoulliNB")
    ax.legend(loc="best")
    plt.show()

# 调用 test_BernoulliNB_binarize
test_BernoulliNB_binarize(X_train,X_test,y_train,y_test)