介绍
本博客是对优秀学习资源进行整理,方便查阅和使用。详细内容请查阅参考资料。
- 参考
- 优质学习资源
Pandas
Numpy:类似于列表,无数值标签;Pandas:类似于字典形式的Numpy,带有行索引和列索引。
基本介绍
两种数据结构:Series和DataFrame。
Series:列表型,仅有行索引。DataFrame:表格型,具有行索引,列索引。
Series
Series的字符串表现形式为:索引在左边,值在右边。不指定索引,默认会自动创建一个0到N-1(N为长度)的整数型索引。
import pandas as pd
import numpy as np

'''Series'''
s = pd.Series([1,3,6,np.nan,44,1])
print(s)
"""
0     1.0
1     3.0
2     6.0
3     NaN
4    44.0
5     1.0
dtype: float64
"""
DataFrame
DataFrame是一个表格型的数据结构,它包含有一组有序的列,每列可以是不同的值类型(数值,字符串,布尔值等)。DataFrame既有行索引也有列索引, 它可以被看做由Series组成的大字典。其创建方式有两种:
numpy数组形式创建。- 字典形式的创建。
DataFrame属性如下:
df.dtypes:数据类型df.index:行索引df.columns:列索引df.values:所有值df.decribe():统计所有数值型数据df.T:数据转置。行列翻转df.sort_index(axis={0,1}, ascending={False, True}):对行索引或者列索引进行排序df.sort_values(by='E'):按某一列的值排序
'''DataFrame的创建方式 1'''
# pd.date_range:生成日期序列
dates = pd.date_range('20160101',periods=6)
# 创建DataFrame型数据
# np.random.randn(rows,cols):随机生成6行4列,并服从正态分布的数组
# index:设置行索引;columns:设置列索引。
df = pd.DataFrame(np.random.randn(6,4),index=dates,columns=['a','b','c','d'])

print(df)
"""
                   a         b         c         d
2016-01-01 -0.253065 -2.071051 -0.640515  0.613663
2016-01-02 -1.147178  1.532470  0.989255 -0.499761
2016-01-03  1.221656 -2.390171  1.862914  0.778070
2016-01-04  1.473877 -0.046419  0.610046  0.204672
2016-01-05 -1.584752 -0.700592  1.487264 -1.778293
2016-01-06  0.633675 -1.414157 -0.277066 -0.442545
"""

'''简单应用1:根据每一个不同的索引来挑选数据'''
print(df['b'])

"""
2016-01-01   -2.071051
2016-01-02    1.532470
2016-01-03   -2.390171
2016-01-04   -0.046419
2016-01-05   -0.700592
2016-01-06   -1.414157
Freq: D, Name: b, dtype: float64
"""

'''创建一组没有给定行标签和列标签的数据'''
df1 = pd.DataFrame(np.arange(12).reshape((3,4)))
print(df1)		# 默认为[0, N-1]之间的整数型索引

"""
   0  1   2   3
0  0  1   2   3
1  4  5   6   7
2  8  9  10  11
"""

'''DataFrame的创建方式 2'''

df2 = pd.DataFrame({'A' : 1.,
                    'B' : pd.Timestamp('20130102'),
                    'C' : pd.Series(1,index=list(range(4)),dtype='float32'),
                    'D' : np.array([3] * 4,dtype='int32'),
                    'E' : pd.Categorical(["test","train","test","train"]),
                    'F' : 'foo'})
print(df2)
"""
     A          B    C  D      E    F
0  1.0 2013-01-02  1.0  3   test  foo
1  1.0 2013-01-02  1.0  3  train  foo
2  1.0 2013-01-02  1.0  3   test  foo
3  1.0 2013-01-02  1.0  3  train  foo
"""

'''查看数据中的类型:dtypes'''
print(df2.dtypes)

"""
df2.dtypes
A           float64
B    datetime64[ns]
C           float32
D             int32
E          category
F            object
dtype: object
"""

'''查看行索引'''

print(df2.index)
# Int64Index([0, 1, 2, 3], dtype='int64')

'''查看列索引'''

print(df2.columns)
# Index(['A', 'B', 'C', 'D', 'E', 'F'], dtype='object')

'''查看所有值'''

print(df2.values)

"""
array([[1.0, Timestamp('2013-01-02 00:00:00'), 1.0, 3, 'test', 'foo'],
       [1.0, Timestamp('2013-01-02 00:00:00'), 1.0, 3, 'train', 'foo'],
       [1.0, Timestamp('2013-01-02 00:00:00'), 1.0, 3, 'test', 'foo'],
       [1.0, Timestamp('2013-01-02 00:00:00'), 1.0, 3, 'train', 'foo']], dtype=object)
"""

'''数据的总结与统计'''

df2.describe()

"""
         A    C    D
count  4.0  4.0  4.0
mean   1.0  1.0  3.0
std    0.0  0.0  0.0
min    1.0  1.0  3.0
25%    1.0  1.0  3.0
50%    1.0  1.0  3.0
75%    1.0  1.0  3.0
max    1.0  1.0  3.0
"""

'''翻转数据:transpose'''

print(df2.T)

"""
0                    1                    2  \
A                    1                    1                    1
B  2013-01-02 00:00:00  2013-01-02 00:00:00  2013-01-02 00:00:00
C                    1                    1                    1
D                    3                    3                    3
E                 test                train                 test
F                  foo                  foo                  foo

                     3
A                    1
B  2013-01-02 00:00:00
C                    1
D                    3
E                train
F                  foo

"""

'''依据数据的 行索引index 进行排序'''
# sort_index:按行索引排序
# axis=1:行;ascending=False:倒序
print(df2.sort_index(axis=1, ascending=False))
"""
     F      E  D    C          B    A
0  foo   test  3  1.0 2013-01-02  1.0
1  foo  train  3  1.0 2013-01-02  1.0
2  foo   test  3  1.0 2013-01-02  1.0
3  foo  train  3  1.0 2013-01-02  1.0
"""

'''依据数据的 数值 进行排序'''
# sort_values(by=列索引)
print(df2.sort_values(by='B'))

"""
     A          B    C  D      E    F
0  1.0 2013-01-02  1.0  3   test  foo
1  1.0 2013-01-02  1.0  3  train  foo
2  1.0 2013-01-02  1.0  3   test  foo
3  1.0 2013-01-02  1.0  3  train  foo
"""
选择数据
操作如下:
df['A']:等价于df.A。其中A为标签型列索引。df[0:3]:数值型行索引df['20130102':'20130104']:标签型行索引df.loc():标签型索引。选择单行数据、所有行连续列数据、跨行数据等。df.iloc():数值型索引(序列)。功能同上。df.ix():混合型索引。功能同上。df[df.A>8]:布尔型索引。
# 建立 6X4 的矩阵数据。
dates = pd.date_range('20130101', periods=6)
df = pd.DataFrame(np.arange(24).reshape((6,4)),index=dates, columns=['A','B','C','D'])

"""
             A   B   C   D
2013-01-01   0   1   2   3
2013-01-02   4   5   6   7
2013-01-03   8   9  10  11
2013-01-04  12  13  14  15
2013-01-05  16  17  18  19
2013-01-06  20  21  22  23
"""

'''根据列索引筛选对应的数据的两种方式'''

print(df['A'])
print(df.A)
"""
2013-01-01     0
2013-01-02     4
2013-01-03     8
2013-01-04    12
2013-01-05    16
2013-01-06    20
Freq: D, Name: A, dtype: int64
"""

'''跨越多行或多列选择:切片'''

print(df[0:3])						# 数值型行索引
"""
            A  B   C   D
2013-01-01  0  1   2   3
2013-01-02  4  5   6   7
2013-01-03  8  9  10  11
"""
# 选择20130102到20130104标签之间的数据,并且包括这两个标签。
print(df['20130102':'20130104'])	# 标签型行索引
"""
A   B   C   D
2013-01-02   4   5   6   7
2013-01-03   8   9  10  11
2013-01-04  12  13  14  15
"""

'''根据标签型索引选择: loc'''

# 通过标签名字选择某一行数据
print(df.loc['20130102'])
"""
A    4
B    5
C    6
D    7
Name: 2013-01-02 00:00:00, dtype: int64
"""
# 选择所有行(:代表所有行)然后选其中某一列或几列数据。
print(df.loc[:,['A','B']])
"""
             A   B
2013-01-01   0   1
2013-01-02   4   5
2013-01-03   8   9
2013-01-04  12  13
2013-01-05  16  17
2013-01-06  20  21
"""
# 选择某行,然后选其中某一列或几列数据。
print(df.loc['20130102',['A','B']])
"""
A    4
B    5
Name: 2013-01-02 00:00:00, dtype: int64
"""

'''根据序列(数值型索引)选择:iloc'''

# 通过位置(数值型索引)选择某一个元素。
print(df.iloc[3,1])
# 13

# 通过位置(数值型索引)连续选。
print(df.iloc[3:5,1:3])
"""
             B   C
2013-01-04  13  14
2013-01-05  17  18
"""

# 通过位置(数值型索引)跨行选
print(df.iloc[[1,3,5],1:3])
"""
             B   C
2013-01-02   5   6
2013-01-04  13  14
2013-01-06  21  22

"""

'''根据混合索引选择:ix'''

# 采用混合索引(数值型、标签型) ix, 其中选择’A’和’C’的两列,并选择前三行的数据。
print(df.ix[:3,['A','C']])
"""
            A   C
2013-01-01  0   2
2013-01-02  4   6
2013-01-03  8  10
"""

'''通过判断的筛选'''

# 采用判断指令 (Boolean indexing) 进行选择。
print(df[df.A>8])
"""
             A   B   C   D
2013-01-04  12  13  14  15
2013-01-05  16  17  18  19
2013-01-06  20  21  22  23
"""
设置值
如何更改数据,添加新数据。
# 建立一个 6X4 的矩阵数据。
dates = pd.date_range('20130101', periods=6)
df = pd.DataFrame(np.arange(24).reshape((6,4)),index=dates, columns=['A','B','C','D'])

"""
             A   B   C   D
2013-01-01   0   1   2   3
2013-01-02   4   5   6   7
2013-01-03   8   9  10  11
2013-01-04  12  13  14  15
2013-01-05  16  17  18  19
2013-01-06  20  21  22  23
"""

'''根据位置设置 loc 和 iloc'''

# 利用索引或者标签确定需要修改值的位置
df.iloc[2,2] = 1111
df.loc['20130101','B'] = 2222

"""
             A     B     C   D
2013-01-01   0  2222     2   3
2013-01-02   4     5     6   7
2013-01-03   8     9  1111  11
2013-01-04  12    13    14  15
2013-01-05  16    17    18  19
2013-01-06  20    21    22  23
"""

'''根据条件设置'''

df[df.A>4] = 0			# 满足条件的所有行赋值为 0

# 更改B中的数, 而更改的位置是取决于 A 的. 对于A大于4的位置. 更改B在相应位置上的数为0.
df.B[df.A>4] = 0		# 满足条件的'B'列赋值为 0
"""
                A     B     C   D
2013-01-01   0  2222     2   3
2013-01-02   4     5     6   7
2013-01-03   8     0  1111  11
2013-01-04  12     0    14  15
2013-01-05  16     0    18  19
2013-01-06  20     0    22  23
"""

'''按行或列设置'''

 # 整列做批处理
df['F'] = np.nan		# 新增'F'列,全部赋值为NaN
"""
             A     B     C   D   F
2013-01-01   0  2222     2   3 NaN
2013-01-02   4     5     6   7 NaN
2013-01-03   8     0  1111  11 NaN
2013-01-04  12     0    14  15 NaN
2013-01-05  16     0    18  19 NaN
2013-01-06  20     0    22  23 NaN
"""

'''添加数据'''

# 添加 Series 序列(但是长度必须对齐)。
df['E'] = pd.Series([1,2,3,4,5,6], index=pd.date_range('20130101',periods=6))
"""
             A     B     C   D   F  E
2013-01-01   0  2222     2   3 NaN  1
2013-01-02   4     5     6   7 NaN  2
2013-01-03   8     0  1111  11 NaN  3
2013-01-04  12     0    14  15 NaN  4
2013-01-05  16     0    18  19 NaN  5
2013-01-06  20     0    22  23 NaN  6
"""
如何处理丢失数据
在导入或处理数据过程中,会产生一些空的或者是 NaN 数据,如何删除或者是填补 NaN 数据?

- 丢弃包含缺失值的数据:
pd.dropna() - 填充缺失值:
pd.fillna() - 判断是否存在缺失值:
pd.isnull() - 检测在数据中是否存在
NaN:np.any(df.isnull()) == True
'''创建含 NaN 的矩阵'''

# 建立一个6X4的矩阵数据并且把两个位置置为空.
dates = pd.date_range('20130101', periods=6)
df = pd.DataFrame(np.arange(24).reshape((6,4)),index=dates, columns=['A','B','C','D'])
df.iloc[0,1] = np.nan
df.iloc[1,2] = np.nan
"""
             A     B     C   D
2013-01-01   0   NaN   2.0   3
2013-01-02   4   5.0   NaN   7
2013-01-03   8   9.0  10.0  11
2013-01-04  12  13.0  14.0  15
2013-01-05  16  17.0  18.0  19
2013-01-06  20  21.0  22.0  23
"""

'''丢弃包含缺失值的数据:pd.dropna()'''

pd.dropna()		# 丢弃包含NAN的所有行。默认设置如下:
# DataFrame.dropna(axis=0, how='any', thresh=None, subset=None, inplace=False)[source]

df.dropna(
    axis=0,     # 0: 对行进行操作; 1: 对列进行操作
    how='any'   # 'any': 只要存在 NaN 就 drop 掉; 'all': 必须全部是 NaN 才 drop
    )
"""
             A     B     C   D
2013-01-03   8   9.0  10.0  11
2013-01-04  12  13.0  14.0  15
2013-01-05  16  17.0  18.0  19
2013-01-06  20  21.0  22.0  23
"""

'''填充缺失值:pd.fillna()'''

df.fillna(value=0)		# NaN 的值用其他值代替, 比如代替成 0:
"""
             A     B     C   D
2013-01-01   0   0.0   2.0   3
2013-01-02   4   5.0   0.0   7
2013-01-03   8   9.0  10.0  11
2013-01-04  12  13.0  14.0  15
2013-01-05  16  17.0  18.0  19
2013-01-06  20  21.0  22.0  23
"""


'''判断是否存在缺失值:pd.isnull()'''

# 判断是否有缺失数据 NaN, 为 True 表示缺失数据
df.isnull() 		# 返回与数据同等维度的bool型数据
"""
                A      B      C      D
2013-01-01  False   True  False  False
2013-01-02  False  False   True  False
2013-01-03  False  False  False  False
2013-01-04  False  False  False  False
2013-01-05  False  False  False  False
2013-01-06  False  False  False  False
"""

# 检测在数据中是否存在 NaN, 如果存在就返回 True:
np.any(df.isnull()) == True
# True
如何导入导出数据
pandas可以读取与存取的资料格式有很多种,像csv、excel、json、html与pickle等, 详细请看官方说明文件。
import pandas as pd #加载模块

'''导入文件'''
#读取以逗号','分割的csv,第一行作为列索引。
data = pd.read_csv('student.csv')
# 读取以‘\t’分割,且没有标签型列索引(header=None)的数据文件, 只读取前10000行。
train = pd.read_table(r'train.csv', header=None, nrows=10000)
test = pd.read_csv(r'test.csv', header=None, sep='\t', nrows=10000)

'''导出文件'''
# 导出文件,并且不导出行列索引
train.to_csv(r'train.csv', index=0, header=0)
# 按原格式导出文件
test.to_csv(r'test.csv')

#打印出data
print(data)

# 将资料存取成pickle
data.to_pickle('student.pickle')
读取数据
read_csv()读取以,分割的文件到DataFrame
read_table()读取以/t分割的文件到DataFrame
该文本中的分割符既有空格又有制表符('/t'),sep参数用'/s+',可以匹配任何空格。
数据合并
pandas处理多组数据的时候往往会要用到数据的合并处理,使用 concat是一种基本的合并方式。而且concat中有很多参数可以调整,合并成你想要的数据形式。
concat 合并方式
常用属性如下:
axis(合并方向):axis=0(按列);axis=1(按行)ignore_index(重置index):ignore_index=Truejoin(合并方式):join='outer': 合并结果取并集;join='inner':合并结果取交集。join_axes(依照axes合并):按照某一数据的索引进行合并。例如:join_axes=[df1.index]append(添加数据):用法同concat类似。但append只有纵向合并,没有横向合并。
import pandas as pd
import numpy as np

#定义资料集
df1 = pd.DataFrame(np.ones((3,4))*0, columns=['a','b','c','d'])
df2 = pd.DataFrame(np.ones((3,4))*1, columns=['a','b','c','d'])
df3 = pd.DataFrame(np.ones((3,4))*2, columns=['a','b','c','d'])

'''axis (合并方向)'''
# axis=0是预设值,因此未设定任何参数时,函数默认axis=0。

#concat纵向合并
res = pd.concat([df1, df2, df3], axis=0)	# 按列合并,行索引不变

#打印结果
print(res)
#     a    b    c    d
# 0  0.0  0.0  0.0  0.0
# 1  0.0  0.0  0.0  0.0
# 2  0.0  0.0  0.0  0.0
# 0  1.0  1.0  1.0  1.0
# 1  1.0  1.0  1.0  1.0
# 2  1.0  1.0  1.0  1.0
# 0  2.0  2.0  2.0  2.0
# 1  2.0  2.0  2.0  2.0
# 2  2.0  2.0  2.0  2.0

# index是0, 1, 2, 0, 1, 2, 0, 1, 2。

'''ignore_index (重置 index)'''

# index_ignore设定为True:重置 index
res = pd.concat([df1, df2, df3], axis=0, ignore_index=True)

#打印结果
print(res)
#     a    b    c    d
# 0  0.0  0.0  0.0  0.0
# 1  0.0  0.0  0.0  0.0
# 2  0.0  0.0  0.0  0.0
# 3  1.0  1.0  1.0  1.0
# 4  1.0  1.0  1.0  1.0
# 5  1.0  1.0  1.0  1.0
# 6  2.0  2.0  2.0  2.0
# 7  2.0  2.0  2.0  2.0
# 8  2.0  2.0  2.0  2.0

##############################
import pandas as pd
import numpy as np

# 定义资料集
df1 = pd.DataFrame(np.ones((3,4))*0, columns=['a','b','c','d'], index=[1,2,3])
df2 = pd.DataFrame(np.ones((3,4))*1, columns=['b','c','d','e'], index=[2,3,4])

'''join (合并方式)'''

# join='outer'为预设值,因此未设定任何参数时,函数默认join='outer'。
# join='outer':按照 并集 合并,数据缺失,则填充NaN。即 合并结果取并集
# join='inner':按照 交集 合并。即 合并结果取交集

# 纵向"外"合并df1与df2
res = pd.concat([df1, df2], axis=0, join='outer')	# 合并结果取并集

print(res)
#     a    b    c    d    e
# 1  0.0  0.0  0.0  0.0  NaN
# 2  0.0  0.0  0.0  0.0  NaN
# 3  0.0  0.0  0.0  0.0  NaN
# 2  NaN  1.0  1.0  1.0  1.0
# 3  NaN  1.0  1.0  1.0  1.0
# 4  NaN  1.0  1.0  1.0  1.0

# 纵向"内"合并df1与df2
res = pd.concat([df1, df2], axis=0, join='inner')	# 合并结果取交集

#打印结果
print(res)
#     b    c    d
# 1  0.0  0.0  0.0
# 2  0.0  0.0  0.0
# 3  0.0  0.0  0.0
# 2  1.0  1.0  1.0
# 3  1.0  1.0  1.0
# 4  1.0  1.0  1.0

# 重置index并打印结果
res = pd.concat([df1, df2], axis=0, join='inner', ignore_index=True)
print(res)
#     b    c    d
# 0  0.0  0.0  0.0
# 1  0.0  0.0  0.0
# 2  0.0  0.0  0.0
# 3  1.0  1.0  1.0
# 4  1.0  1.0  1.0
# 5  1.0  1.0  1.0

########################
import pandas as pd
import numpy as np

# 定义资料集
df1 = pd.DataFrame(np.ones((3,4))*0, columns=['a','b','c','d'], index=[1,2,3])
df2 = pd.DataFrame(np.ones((3,4))*1, columns=['b','c','d','e'], index=[2,3,4])

'''join_axes (依照 axes 合并)'''

# 依照`df1.index`进行横向合并
res = pd.concat([df1, df2], axis=1, join_axes=[df1.index])	# 以某一数据的行索引为标准合并

# 打印结果
print(res)
#     a    b    c    d    b    c    d    e
# 1  0.0  0.0  0.0  0.0  NaN  NaN  NaN  NaN
# 2  0.0  0.0  0.0  0.0  1.0  1.0  1.0  1.0
# 3  0.0  0.0  0.0  0.0  1.0  1.0  1.0  1.0

# 移除join_axes,并打印结果
res = pd.concat([df1, df2], axis=1)
print(res)
#     a    b    c    d    b    c    d    e
# 1  0.0  0.0  0.0  0.0  NaN  NaN  NaN  NaN
# 2  0.0  0.0  0.0  0.0  1.0  1.0  1.0  1.0
# 3  0.0  0.0  0.0  0.0  1.0  1.0  1.0  1.0
# 4  NaN  NaN  NaN  NaN  1.0  1.0  1.0  1.0

###################
import pandas as pd
import numpy as np

#定义资料集
df1 = pd.DataFrame(np.ones((3,4))*0, columns=['a','b','c','d'])
df2 = pd.DataFrame(np.ones((3,4))*1, columns=['a','b','c','d'])
df3 = pd.DataFrame(np.ones((3,4))*1, columns=['a','b','c','d'])
s1 = pd.Series([1,2,3,4], index=['a','b','c','d'])


'''append (添加数据)'''

# append只有纵向合并,没有横向合并。

# 将df2合并到df1的下面,以及重置index,并打印出结果
res = df1.append(df2, ignore_index=True)
print(res)
#     a    b    c    d
# 0  0.0  0.0  0.0  0.0
# 1  0.0  0.0  0.0  0.0
# 2  0.0  0.0  0.0  0.0
# 3  1.0  1.0  1.0  1.0
# 4  1.0  1.0  1.0  1.0
# 5  1.0  1.0  1.0  1.0

# 合并多个df,将df2与df3合并至df1的下面,以及重置index,并打印出结果
res = df1.append([df2, df3], ignore_index=True)
print(res)
#     a    b    c    d
# 0  0.0  0.0  0.0  0.0
# 1  0.0  0.0  0.0  0.0
# 2  0.0  0.0  0.0  0.0
# 3  1.0  1.0  1.0  1.0
# 4  1.0  1.0  1.0  1.0
# 5  1.0  1.0  1.0  1.0
# 6  1.0  1.0  1.0  1.0
# 7  1.0  1.0  1.0  1.0
# 8  1.0  1.0  1.0  1.0

# 合并series,将s1合并至df1,以及重置index,并打印出结果
res = df1.append(s1, ignore_index=True)
print(res)
#     a    b    c    d
# 0  0.0  0.0  0.0  0.0
# 1  0.0  0.0  0.0  0.0
# 2  0.0  0.0  0.0  0.0
# 3  1.0  2.0  3.0  4.0
merge 合并方式
pandas中的merge和concat类似,但主要是用于两组有key column的数据,统一索引的数据。通常也被用在Database的处理当中。用于索引对照合并。
常用属性如下:
- 依据一组索引合并(
on='key'): 根据索引'key'合并 - 依据两组key合并(
on=['key1', 'key2'], how='inner'):其中,how = [ 'outer', 'inner','待合并DataFrame名']分别对应于合并结果取并集、合并结果取交集、基于待合并的DataFrame变量名进行合并。 Indicator:合并结果包含合并记录。indicator=True:将合并的记录放在新的一列。indicator='indicator_key':自定义indicator的名称。- 依据
index合并(left_index=True, right_index=True):‘待合并的DataFrame变量名’=True - 解决overlapping(key重叠)的问题(
suffixes=['_boy', '_girl']):suffixes为重复key后添加后缀。
import pandas as pd

# 定义资料集并打印出
left = pd.DataFrame({'key': ['K0', 'K1', 'K2', 'K3'],
                             'A': ['A0', 'A1', 'A2', 'A3'],
                             'B': ['B0', 'B1', 'B2', 'B3']})
right = pd.DataFrame({'key': ['K0', 'K1', 'K2', 'K3'],
                              'C': ['C0', 'C1', 'C2', 'C3'],
                              'D': ['D0', 'D1', 'D2', 'D3']})

print(left)
#    A   B key
# 0  A0  B0  K0
# 1  A1  B1  K1
# 2  A2  B2  K2
# 3  A3  B3  K3

print(right)
#    C   D key
# 0  C0  D0  K0
# 1  C1  D1  K1
# 2  C2  D2  K2
# 3  C3  D3  K3

'''依据一组key合并'''

# 依据key column合并,并打印出
res = pd.merge(left, right, on='key')		# 根据索引'key'合并

print(res)
     A   B key   C   D
# 0  A0  B0  K0  C0  D0
# 1  A1  B1  K1  C1  D1
# 2  A2  B2  K2  C2  D2
# 3  A3  B3  K3  C3  D3

#####################

import pandas as pd

# 定义资料集并打印出
left = pd.DataFrame({'key1': ['K0', 'K0', 'K1', 'K2'],
                      'key2': ['K0', 'K1', 'K0', 'K1'],
                      'A': ['A0', 'A1', 'A2', 'A3'],
                      'B': ['B0', 'B1', 'B2', 'B3']})
right = pd.DataFrame({'key1': ['K0', 'K1', 'K1', 'K2'],
                       'key2': ['K0', 'K0', 'K0', 'K0'],
                       'C': ['C0', 'C1', 'C2', 'C3'],
                       'D': ['D0', 'D1', 'D2', 'D3']})

print(left)
#    A   B key1 key2
# 0  A0  B0   K0   K0
# 1  A1  B1   K0   K1
# 2  A2  B2   K1   K0
# 3  A3  B3   K2   K1

print(right)
#    C   D key1 key2
# 0  C0  D0   K0   K0
# 1  C1  D1   K1   K0
# 2  C2  D2   K1   K0
# 3  C3  D3   K2   K0

'''依据两组key合并'''

# 合并时有4种方法how = ['left', 'right', 'outer', 'inner'],预设值how='inner'。
# 依据key1与key2 columns进行合并,并打印出四种结果['left', 'right', 'outer', 'inner']
res = pd.merge(left, right, on=['key1', 'key2'], how='inner')	# 合并结果取交集
print(res)
#    A   B key1 key2   C   D
# 0  A0  B0   K0   K0  C0  D0
# 1  A2  B2   K1   K0  C1  D1
# 2  A2  B2   K1   K0  C2  D2

res = pd.merge(left, right, on=['key1', 'key2'], how='outer')	# 合并结果取并集
print(res)
#     A    B key1 key2    C    D
# 0   A0   B0   K0   K0   C0   D0
# 1   A1   B1   K0   K1  NaN  NaN
# 2   A2   B2   K1   K0   C1   D1
# 3   A2   B2   K1   K0   C2   D2
# 4   A3   B3   K2   K1  NaN  NaN
# 5  NaN  NaN   K2   K0   C3   D3

# 合并结果以某一数据为准,该数据全部包含在内。
res = pd.merge(left, right, on=['key1', 'key2'], how='left')
print(res)
#    A   B key1 key2    C    D
# 0  A0  B0   K0   K0   C0   D0
# 1  A1  B1   K0   K1  NaN  NaN
# 2  A2  B2   K1   K0   C1   D1
# 3  A2  B2   K1   K0   C2   D2
# 4  A3  B3   K2   K1  NaN  NaN

res = pd.merge(left, right, on=['key1', 'key2'], how='right')
print(res)
#     A    B key1 key2   C   D
# 0   A0   B0   K0   K0  C0  D0
# 1   A2   B2   K1   K0  C1  D1
# 2   A2   B2   K1   K0  C2  D2
# 3  NaN  NaN   K2   K0  C3  D3

#-----------------------

import pandas as pd

# 定义资料集并打印出
df1 = pd.DataFrame({'col1':[0,1], 'col_left':['a','b']})
df2 = pd.DataFrame({'col1':[1,2,2],'col_right':[2,2,2]})

print(df1)
#   col1 col_left
# 0     0        a
# 1     1        b

print(df2)
#   col1  col_right
# 0     1          2
# 1     2          2
# 2     2          2

'''Indicator:合并结果包含合并记录'''

# indicator=True会将合并的记录放在新的一列。

# 依据col1进行合并,并启用indicator=True,最后打印出
res = pd.merge(df1, df2, on='col1', how='outer', indicator=True)	# 显式合并方式
print(res)
#   col1 col_left  col_right      _merge
# 0   0.0        a        NaN   left_only
# 1   1.0        b        2.0        both
# 2   2.0      NaN        2.0  right_only
# 3   2.0      NaN        2.0  right_only

# 自定义indicator的名称,并打印
res = pd.merge(df1, df2, on='col1', how='outer', indicator='indicator_column')
print(res)
#   col1 col_left  col_right indicator_column
# 0   0.0        a        NaN        left_only
# 1   1.0        b        2.0             both
# 2   2.0      NaN        2.0       right_only
# 3   2.0      NaN        2.0       right_only

#-------------------

import pandas as pd

# 定义资料集并打印出
left = pd.DataFrame({'A': ['A0', 'A1', 'A2'],
                     'B': ['B0', 'B1', 'B2']},
                     index=['K0', 'K1', 'K2'])
right = pd.DataFrame({'C': ['C0', 'C2', 'C3'],
                      'D': ['D0', 'D2', 'D3']},
                     index=['K0', 'K2', 'K3'])

print(left)
#     A   B
# K0  A0  B0
# K1  A1  B1
# K2  A2  B2

print(right)
#     C   D
# K0  C0  D0
# K2  C2  D2
# K3  C3  D3

'''依据index合并'''

# 依据左右资料集的index进行合并,how='outer',并打印出
res = pd.merge(left, right, left_index=True, right_index=True, how='outer')
print(res)
#      A    B    C    D
# K0   A0   B0   C0   D0
# K1   A1   B1  NaN  NaN
# K2   A2   B2   C2   D2
# K3  NaN  NaN   C3   D3

#依据左右资料集的index进行合并,how='inner',并打印出
res = pd.merge(left, right, left_index=True, right_index=True, how='inner')
print(res)
#     A   B   C   D
# K0  A0  B0  C0  D0
# K2  A2  B2  C2  D2

'''解决overlapping的问题:suffixes'''

import pandas as pd

# 定义资料集
boys = pd.DataFrame({'k': ['K0', 'K1', 'K2'], 'age': [1, 2, 3]})
girls = pd.DataFrame({'k': ['K0', 'K0', 'K3'], 'age': [4, 5, 6]})

# 使用suffixes解决overlapping的问题。为重复key后添加后缀。
res = pd.merge(boys, girls, on='k', suffixes=['_boy', '_girl'], how='inner')
print(res)
#    age_boy   k  age_girl
# 0        1  K0         4
# 1        1  K0         5
数据可视化
如何将数据可视化。使用 matplotlib 仅仅是用来 show 图片的, 即 plt.show()。
具体用法可查阅官网:pandas可视化
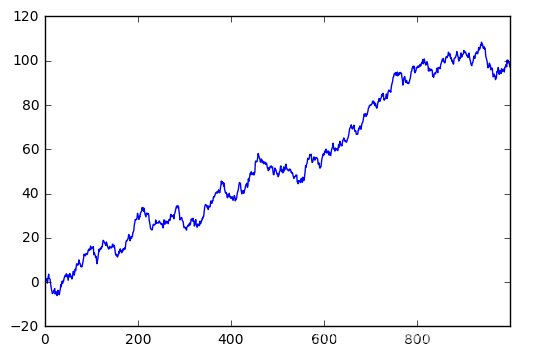
Series可视化
import pandas as pd
import numpy as np
import matplotlib.pyplot as plt

'''plot Series'''

# 创建一个Series:随机生成1000个线性的数据,索引显式赋值。
data = pd.Series(np.random.randn(1000),index=np.arange(1000))

# 数据累加
data.cumsum()

# pandas 数据可以直接观看其可视化形式
data.plot()		# 等价于plt.plot(x=,y=),data本身是数据,可直接plot。
plt.show()
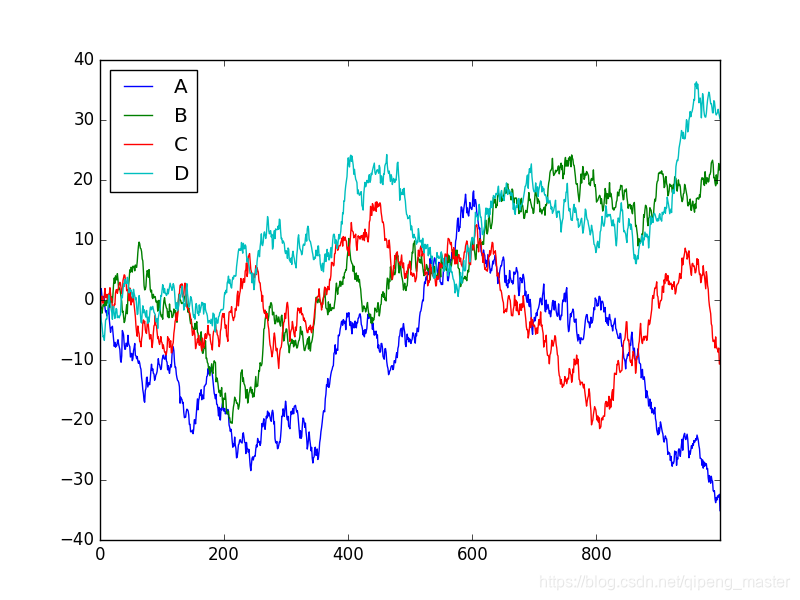
Dataframe可视化
data = pd.DataFrame(
    np.random.randn(1000,4),
    index=np.arange(1000),
    columns=list("ABCD")
    )
data.cumsum()
data.plot()		# plot()包含若干参数,有需要自行查阅。
plt.show()
scatter散点图
除了plot,我经常会用到还有scatter(散点图),图像类别如下:
- bar
- hist
- box
- kde
- area
- scatter
- hexbin
''' plot 和 scatter'''

# scatter只有x,y两个属性,分别给x, y指定数据
ax = data.plot.scatter(x='A',y='B',color='DarkBlue',label='Class1')

# 再画一个在同一个ax上面,选择不一样的数据列,不同的 color 和 label
# 将下面的 data 画在上一个 ax 上面
data.plot.scatter(x='A',y='C',color='LightGreen',label='Class2',ax=ax)
plt.show()
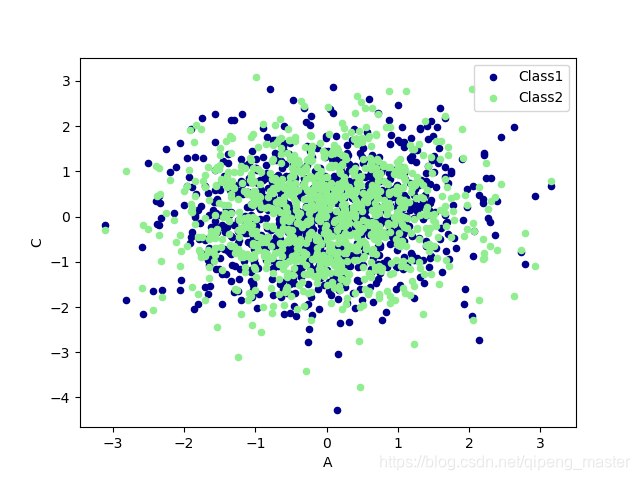
以上两种呈现方式,一种是线性的方式,一种是散点图。