原创不易,转载前请注明博主的链接地址:Blessy_Zhu https://blog.csdn.net/weixin_42555080
一、Pareto Principle帕累托法则
The Pareto principle (also known as the 80 20 rule) states that, for many events, roughly 80% of the effects come from20% of the causes. Management consultant Joseph M. Juran suggested the principle and named it after Italian economist Vilfredo Pareto, who observed in 1906 that 80% of the land in Italy was owned by 20% of the population. The original observation was in connection with population and wealth. Pareto noticed that 80% of Italy’s land was owned by 20% of the population. He then carried out surveys on a variety of other countries and found to his surprise that a similar distribution applied.
80/20法则(The 80/20 Rule),又称为帕累托法则、帕累托定律、最省力法则或不平衡原则、犹太法则。此法则是由约瑟夫·朱兰(Joseph M. Juran)根据维尔弗雷多·帕累托本人当年对意大利20%的人口拥有80%的财产的观察而推论出来的。
80:20法则只是帕累托分布函数在特定常数时的一个特定值,其他极端的还有64:4等,在财富分配方面,意味着80%的财富被20%的人拥有,或者64%的财富属于4%的人。
财富按帕累托函数分布,但社会福利的目标是令这个函数变得尽量扁平,不是那么陡峭,令财富的分配不那么极端。
80/20的法则认为:原因和结果、投入和产出、努力和报酬之间本来存在着无法解释的不平衡。一般来说,投入和努力可以分为两种不同的类型:
- 多数,它们只能造成少许的影响;
- 少数,它们造成主要的、重大的影响。
The distribution is claimed to appear in several different aspects relevant to entrepreneurs and business managers. For example:
- 80% of a company’s profits come from 20% of its customers
- 80% of a company’s complaints come from 20% of its customers
- 80% of a company’s profits come from 20% of the time its staff spend
- 80% of a company’s sales come from 20% of its products
- 80% of a company’s sales are made by 20% of its sales staff
- 80%的产出源自20%的投入;
- 80%的结论源自20%的起因;
- 80%的收获源自20%的努力
犹太人认为,存在一条78∶22宇宙法则,世界上许多事物,都是按78∶22这样的比率存在的。比如空气中,氮气占78%,氧气及其他气体占22%。人体中的水分占78%,其他为22%等等。他们把这个法则也用在生存和发展之道上,始终坚持二八法则,把精力用在最见成效的地方。美国企业家威廉·穆尔在为格利登公司销售油漆时,头一个月仅挣了160美元。此后,他仔细研究了犹太人经商的“二八法则”,分析了自己的销售图表,发现他80%的收益却来自20%的客户,但是他过去却对所有的客户花费了同样多的时间——这就是他过去失败的主要原因。于是,他要求把他最不活跃的36个客户重新分派给其他销售人员,而自己则把精力集中到最有希望的客户上。不久,他一个月就赚到了1000美元。穆尔学会了犹太人经商的二八法则,连续九年从不放弃这一法则,这使他最终成为凯利—穆尔油漆公司的董事长。
二、Pareto Optimality帕累托最优
2.1 definition
Pareto efficiency, or Pareto optimality, is a state of allocationof resources in which it is impossible to make any oneindividual better off without making at least one individualworse off. The term is named after Vilfredo Pareto(1848 1923), an Italian economist who used the concept inhis studies of economic efficiency and income distribution.The concept has applications in academic fields such aseconomics, engineering, and the life sciences.
帕累托最优( Pareto Optimality),也称为帕累托效率( Pareto efficiency),是指资源分配的一种理想状态,假定固有的一群人和可分配的资源,从一种分配状态到另一种状态的变化中,在没有使任何人境况变坏的前提下,使得至少一个人变得更好。
帕累托最优状态是不可能再有更多的帕累托改进的余地;换句话说,帕累托改进是达到帕累托最优的路径和方法。
帕累托改进是指一种变化,在没有使任何人境况变坏的前提下,使得至少一个人变得更好。帕累托最优是公平与效率的“理想王国”
需要指出的是,帕累托最优只是各种理想态标准中的“最低标准”。也就是说,一种状态如果尚未达到帕累托最优,那么它一定是不理想的,因为还存在改进的余地,可以在不损害任何人的前提下使某一些人的福利得到提高。但是一种达到了帕累托最优的状态并不一定真的很“理想”。例如,假设一个社会里只有一个百万富翁和一个快饿死的乞丐,如果这个百万富翁拿出自己财富的万分之一,就可以使后者免于死亡。但是因为这样无偿的财富转移损害了富翁的福利(假设这个乞丐没有什么可以用于回报富翁的资源或服务),所以进行这种财富转移并不是帕累托改进,而这个只有一个百万富翁和一个饿死乞丐的社会可以被认为是帕累托最优的。
If economic allocation in any system is not Pareto efficient,there is potential for a Pareto improvement -an increase in Pareto efficiency: through reallocation, improvements can be made to at least one participant’s well-being without reducing any other participant’s well-being.
It is important to note, however, that a change from an inefficient allocation to an efficient one is not necessarily a Pareto improvement. Thus, in practice, ensuring that nobodyis disadvantaged by a change aimed at achieving Pareto efficiency may require compensation of one or more parties.
2.2 Condition
一般来说,达到帕累托最优时,会同时满足以下3个条件:
- 交换最优:即使再交易,个人也不能从中得到更大的利益。此时对任意两个消费者,任意两种商品的边际替代率是相同的,且两个消费者的效用同时得到最大化。
- 生产最优:这个经济体必须在自己的生产可能性边界上。此时对任意两个生产不同产品的生产者,需要投入的两种生产要素的边际技术替代率是相同的,且两个生产者的产量同时得到最大化。
- 产品混合最优:经济体产出产品的组合必须反映消费者的偏好。此时任意两种商品之间的边际替代率必须与任何生产者在这两种商品之间的边际产品转换率相同。
2.3 State
- 如果对于某种既定的资源配置状态,所有的帕累托改进均不存在,即在该状态上,任何改变都不可能使至少一个人的状况变好而又不使任何人的状况变坏,则称这种资源配置状态为帕累托最优状态。
- 帕累托最优状态是由意大利经济学家帕累托提出来的一种经济状态,是指具有以下性质的资源配置状态,即任何形式的资源重新配置,都不可能使至少有一人受益而又不使其他任何人受到损害。人们通常也把能使至少一人的境况变好而没有人的境况变坏的资源重新配置称为帕累托改进,所以帕累托最优状态也就是已不再存在帕累托改进的资源配置状态。
三、 Gini coefficient(基尼系数)
The Gini coefficient (also known as the Gini index or Giniratio) (jee-nee) is a measure of statistical dispersion(分散度) in tended to represent the income distribution of a nation’s residents,and is the most commonly used measure of inequality. It was developed by the Italian statistician and sociologist Corrado Gini and published in his 1912 paper “Variability andMutability”
20世纪初意大利经济学家基尼,于1922年提出的定量测定收入分配差异程度的指标。它是根据洛伦茨曲线找出了判断分配平等程度的指标。

The Gini coefficient measures the inequality among values of a frequency distribution (for example levels of income). A Gini coefficient of zero expresses perfect equality, where allvalues are the same (for example, where everyone has thesame income). A Gini coefficient of one (or l 00%) expresses maximal inequality among values (for example where only one person has all the income or consumption, and all others have none). However, a value greater than one may occur if some persons represent negative contribution to the total (e.g.,have negative income or wealth). For larger groups, values close to or above l are very unlikely in practice.
The Gini coefficient is usually defined mathematically based on the Lorenz curve, which plots the proportion of the total income of the population (y axis) that is cumulatively earned by the bottom x% of the population (see diagram). The line at 45 degrees thus represents perfect equality of incomes. TheGini coefficient can then be thought of as the ratio of the areathat lies between the line of equality and the Lorenz curve( marked A in the diagram) over the total area under the lineof equality (marked A and B in the diagram);i.e, G=A/(A + B).
If all people have non-negative income (or wealth, as the casemay be), the Gini coefficient can the oretically range from 0(complete equality) to 1 (complete inequality); it is some times expressed as a percentage ranging between 0 and 100 In practice, both extreme values are not quite reached. If negative values are possible (such as the negative wealth ofpeople with debts), then the Gini coefficient could the oretically be more than 1. Normally the mean (or total) is assumed positive, which rules out a Gini coefficient less than zero.
图中横轴代表家庭数比例x%(注意此比例计算是从低收入家庭开始计算的,到100%时才涵盖最富有家庭),纵轴代表该比例的家庭拥有的财富占社会总财富的比率y%,绿线代表绝对平均状态(即每个家庭拥有财富相同)下,低收入人群所占人口百分比和总收入百分比之间的关系(财富占比等于家庭数占比) ;红线代表实际情况(实际是由财富-家庭分布曲线积分而来),这条曲线也称作洛伦兹曲线(Lorenz curve) ,蓝线代表绝对不平均的情况。图中红线和绿线中间的面积越小,收入分配越平等。基尼系数表示的是绿红线间面积与绿蓝线间面积之比。基尼系数越小,红线与绿线越接近,反映收入水平越平均;反之,基尼系数越大,红线与绿线越远离,反映财富向少数人集中。
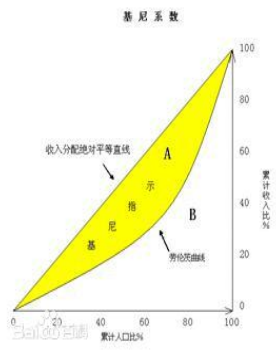
设实际收入分配曲线和收入分配绝对平等曲线之间的面积为A,实际收入分配曲线右下方的面积为B。并以A除以A+B的商表示不平等程度。这个数值被称为基尼系数或称洛伦茨系数。如果A为零,基尼系数为零,表示收入分配完全平等;如果B为零则系数为1,收入分配绝对不平等。该系数可在零和1之间取任何值。收入分配越是趋向平等,洛伦茨曲线的弧度越小,基尼系数也越小,反之,收入分配越是趋向不平等,洛伦茨曲线的弧度越大,那么基尼系数也越大。如果个人所得税能使收入均等化,那么,基尼系数即会变小。
基尼系数的计算公式为:

其中,X代表各组的人口比重,Y代表各组的收入比重,V代表各组累计的收入比重,i=1,2,3,…,n,n代表分组的组数。
四、 总结
这篇文章主要讲了Pareto Principle、Pareto Optimality and Gini coefficient.以上内容参考教师课件。这篇文章就到这里了,欢迎大佬们多批评指正,也欢迎大家积极评论多多交流。