library(TraMineR)
library(sunburstR)
library(pipeR)

# use example from TraMineR vignette
data("mvad")
mvad.alphab <- c(
  "employment", "FE", "HE", "joblessness",
  "school", "training"
)
mvad.seq <- seqdef(mvad, 17:86, xtstep = 6, alphabet = mvad.alphab)

# to make this work, we'll compress the sequences with seqdss
#   could also aggregate with dply later
seqtab( seqdss(mvad.seq), tlim = 0, format = "SPS" ) %>>%
  attr("freq") %>>%
  (
    data.frame(
      # appending "-end" is necessary for this to work
      sequence = paste0(
        gsub(
          x = names(.$Freq)
          , pattern = "(/[0-9]*)"
          , replacement = ""
          , perl = T
        )
        ,"-end"
      )
      ,freq = as.numeric(.$Freq)
      ,stringsAsFactors = FALSE
    )
  ) %>>%
  sunburst
library(sunburstR)

df <- data.frame(
  date = seq.Date(
    as.Date('2014-01-01'),
    as.Date('2016-12-31'),
    by = "days"
  ),
  stringsAsFactors = FALSE
)

df$year = format(df$date, "%Y")
df$quarter = paste0("Q", ceiling(as.numeric(format(df$date,"%m"))/3))
df$month = format(df$date, "%b")
df$path = paste(df$year, df$quarter, df$month, sep="-")
df$count = rep(1, nrow(df))

sunburst(
  data.frame(xtabs(count~path,df)),
  # added a degree of difficulty by providing
  #  not easily sortable names
  sortFunction = htmlwidgets::JS(
    "
    function(a,b){
    abb = {
    2014:-7,
    2015:-6,
    2016:-5,
    Q1:-4,
    Q2:-3,
    Q3:-2,
    Q4:-1,
    Jan:1,
    Feb:2,
    Mar:3,
    Apr:4,
    May:5,
    Jun:6,
    Jul:7,
    Aug:8,
    Sep:9,
    Oct:10,
    Nov:11,
    Dec:12
    }
    return abb[a.data.name] - abb[b.data.name];
    }
    "
  )
  )
library(sunburstR)
library(pipeR)

#  read the csv data downloaded from the Google Fusion Table linked in the article
ngrams2 <- read.csv(
  system.file(
    "examples/ngrams2.csv"
    ,package="sunburstR"
  )
  , stringsAsFactors = FALSE
)

ngrams2 %>>%
  #  let's look at ngrams at the start of a word, so columns 1 and 3
  (.[,c(1,3)]) %>>%
  #  split the ngrams into a sequence by splitting each letter and adding -
  (
    data.frame(
      sequence = strsplit(.[,1],"") %>>%
        lapply( function(ng){ paste0(ng,collapse = "-") } ) %>>%
        unlist
      ,freq = .[,2]
      ,stringsAsFactors = FALSE
    )
  ) %>>%
  sunburst


library(htmltools)

ngrams2 %>>%
  (
    lapply(
      seq.int(3,ncol(.))
      ,function(letpos){
        (.[,c(1,letpos)]) %>>%
          #  split the ngrams into a sequence by splitting each letter and adding -
          (
            data.frame(
              sequence = strsplit(.[,1],"") %>>%
                lapply( function(ng){ paste0(ng,collapse = "-") } ) %>>%
                unlist
              ,freq = .[,2]
              ,stringsAsFactors = FALSE
            )
          ) %>>%
          ( tags$div(style="float:left;",sunburst( ., height = 300, width = 300 )) )
      }
    )
  ) %>>%
  tagList %>>%
  browsable
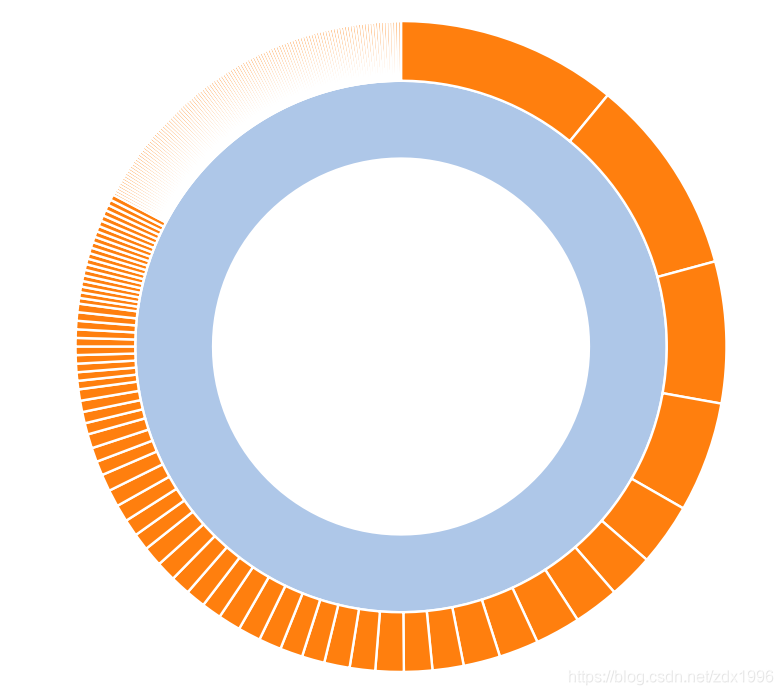
library(sunburstR)
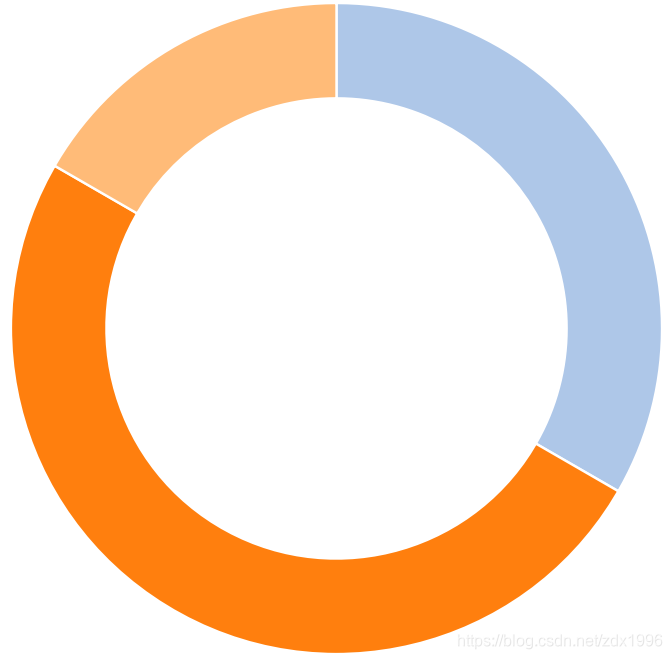
df <- data.frame(
group = c("foo", "bar", "xyz"),
value = c(1, 3, 2)
)
sunburst(df,
# create a trivial sort function
sortFunction = htmlwidgets::JS('function(x) {return x;}'))
new_order <- c(3,2,1)
sunburst(df[new_order,],
sortFunction = htmlwidgets::JS('function(x) {return x;}'))
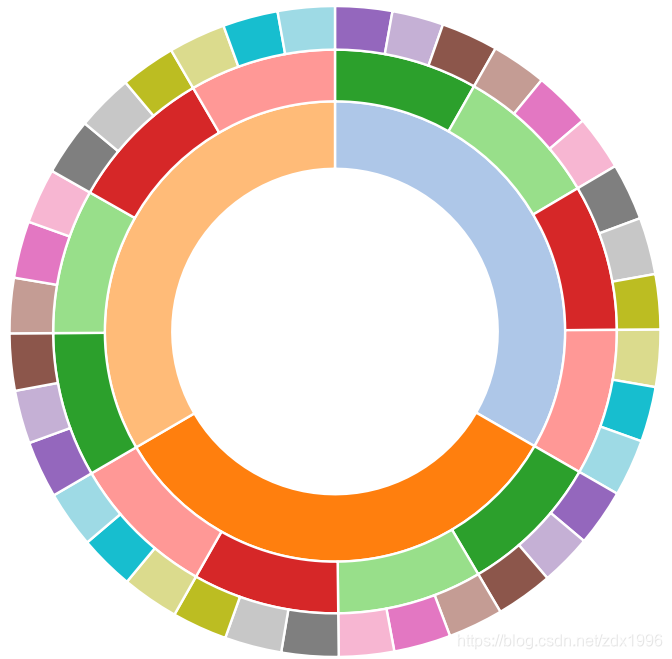
library(sunburstR)

# use a sample of the sequences csv data
sequences <- read.csv(
  system.file("examples/visit-sequences.csv",package="sunburstR")
  ,header = FALSE
  ,stringsAsFactors = FALSE
)[1:200,]

# create a d2b sunburst
sund2b(sequences)

# change the colors
#   using d3.js categorical color scheme
sund2b(
  sequences,
  colors = htmlwidgets::JS("d3.scaleOrdinal(d3.schemeCategory20b)")
)
#  using RColorBrewer palette
sund2b(
  sequences,
  colors = list(range = RColorBrewer::brewer.pal(9, "Set3"))
)
#  using a color column from the R dataset
#  treemap has an amazing treecolors ability
library(treemap)
library(d3r)
rhd <- random.hierarchical.data()
tm <- treemap(
  rhd,
  index = paste0("index", 1:3),
  vSize = "x",
  draw = FALSE
)$tm
sund2b(
  d3_nest(tm, value_cols = colnames(tm)[-(1:3)]),
  colors = htmlwidgets::JS(
    # yes this is a little different, so please pay attention
    #  "function(d) {return d.color}" will not work
    "function(name, d){return d.color || '#ccc';}"
  ),
  valueField = "vSize"
)


# use sund2b in Shiny
library(shiny)
ui <- sund2bOutput("sun")
server <- function(input, output, session) {
  output$sun <- renderSund2b({
    sund2b(sequences)
  })
}
shinyApp(ui, server)
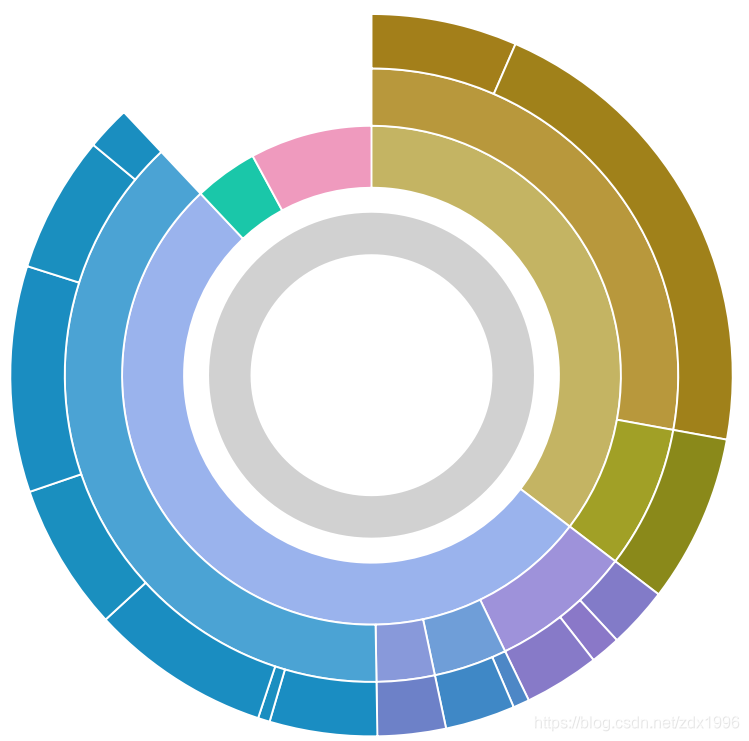
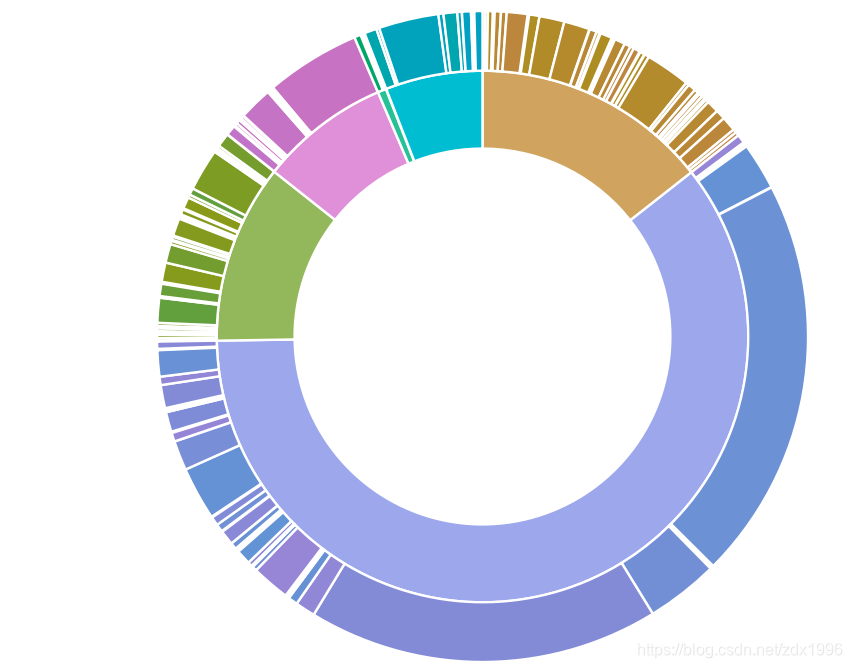
library(treemap)
  library(sunburstR)
  library(d3r)

  # use example from ?treemap::treemap
  data(GNI2014)
  tm <- treemap(GNI2014,
          index=c("continent", "iso3"),
          vSize="population",
          vColor="continent",
          type="index")

  tm_nest <- d3_nest(
    tm$tm[,c("continent", "iso3", "vSize", "color")],
    value_cols = c("vSize", "color")
  )

  sunburst(
    data = tm_nest,
    valueField = "vSize",
    count = TRUE,
    # to avoid double counting with pre-summed trees
    # use sumNodes = FALSE
    sumNodes = FALSE,
    colors = htmlwidgets::JS("function(d){return d3.select(this).datum().data.color;}"),
    withD3 = TRUE
  )