一、GARCH模型
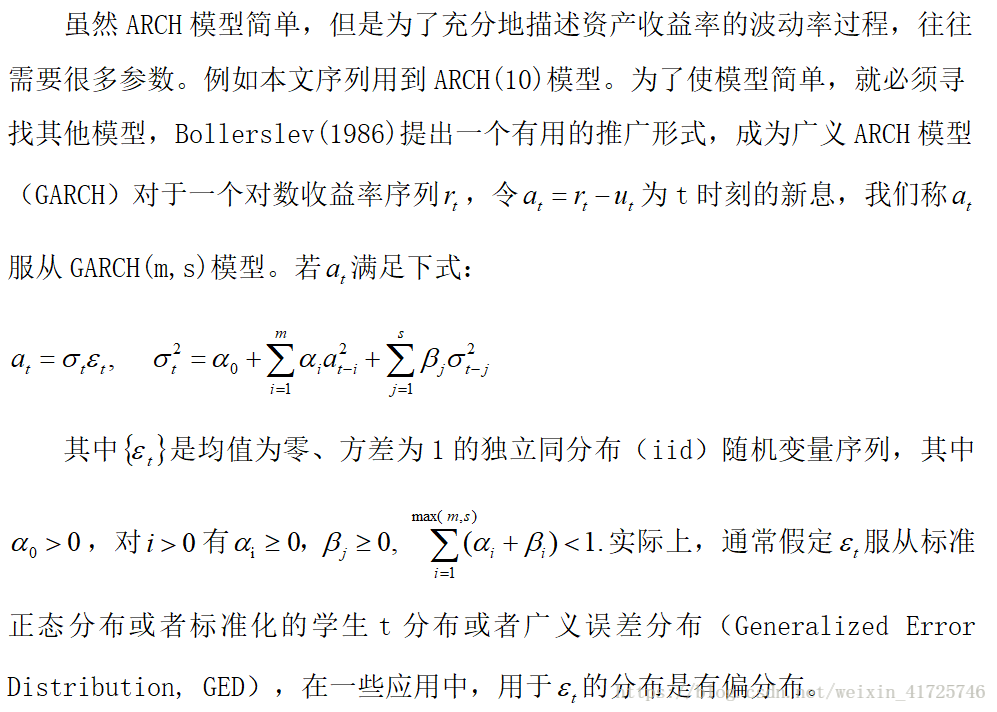
ARCH模型的建模过程也适用于GARCH模型的建模。在大多数的应用中,只用到低阶的GARCH模型,如GARCH(1,1)模型、GARCH(1,2)模型和GARCH(2,1)模型,因此本文只对比这三种阶数的模型。
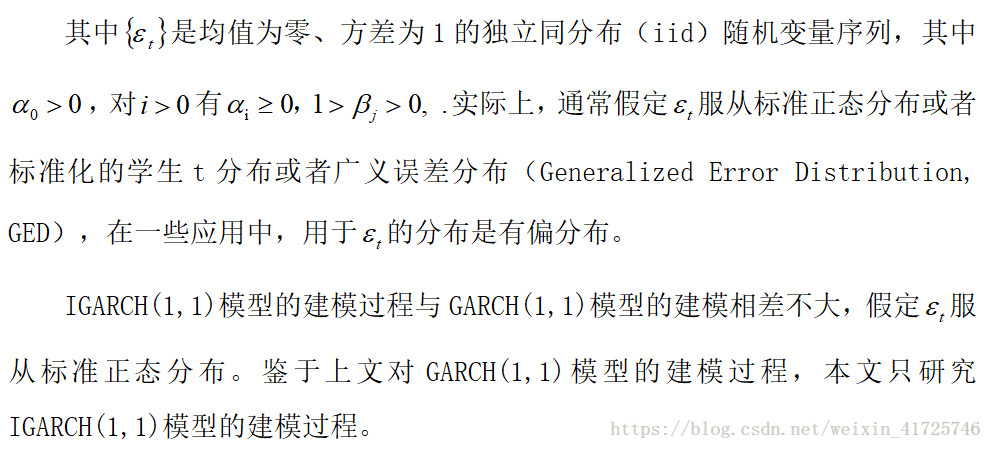
二、IGARCH模型

三、GARCH-M模型

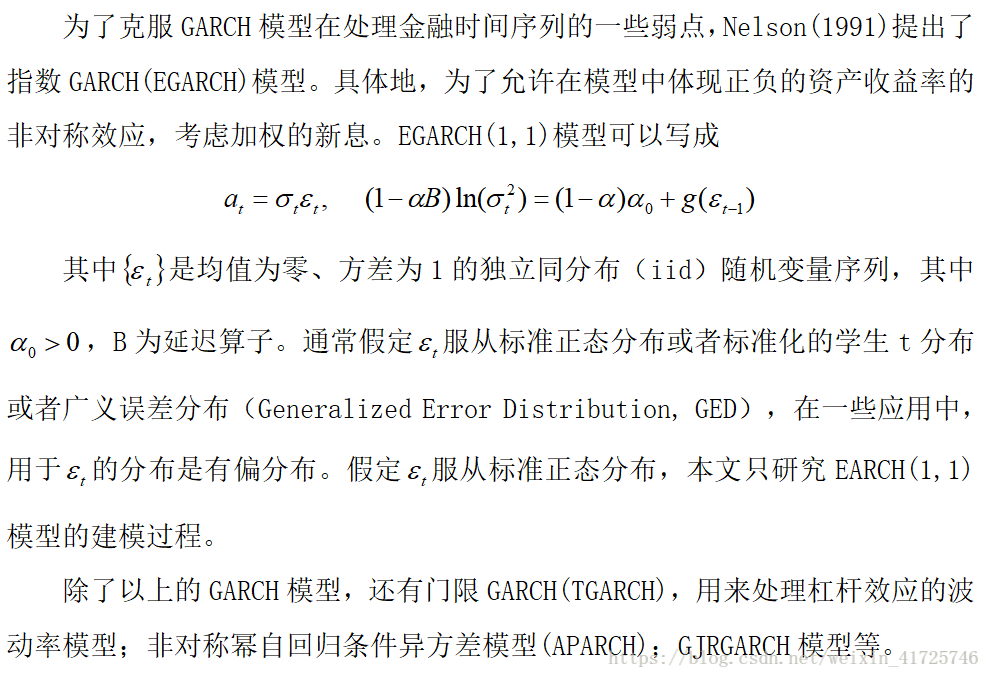
四、EGARCH模型
五、模型验证以及预测


library(fGarch)
library(rugarch)
m<-garchFit(~1+garch(10,0),data=dhp,trace=F)
summary(m)
resi<-residuals(m,standardize=T)
m1<-garchFit(~1+garch(16,0),data=dhp,trace=F)
summary(m1)
resi1<-residuals(m1,standardize=T)
tgarch11.spec = ugarchspec(variance.model = list(model="fGARCH",submodel="EGARCH", garchOrder=c(1,1)),mean.model = list(armaOrder=c(0,0)))#EGARCH
fit <- ugarchfit(spec=tgarch11.spec, data=dhp,solver='solnp')
fit
spec1=ugarchspec(variance.model=list(model="iGARCH",garchOrder=c(1,1)),
mean.model=list(armaOrder=c(0,0)))#IGARCH
mm=ugarchfit(data=dhp,spec=spec1)
fore = ugarchforecast(mm,50)
source("garchM.R")
mm<-garchM(dhp)#GARCH-M
summary(mm)
resi<-residuals(m,standardize=T)#残差走势图
time<-c(1:3000)/240+2006
plot(time,resi,xlab="year",ylab="stand-resi,",type="l",lty=1,col="blue",main="标准化残差时序图")
acf(resi,lag=40)
pacf(resi^2,lag=40)
a<-predict(m,100)#预测
names(a)
a1<-a$meanError#预测波动率走势图
date<-c(1:100)/240+2018.3583
plot(date,a1,xlab="time",ylab="预测的波动率",type="l",lty=3,col="blue",main="预测的波动率走势图")
pred.model <- predict(m, n.ahead = 10, trace =FALSE, mse = 'cond', plot=FALSE)
View(pred.model)