依赖:
yarn add echarts echarts-for-react --save引入:
import ReactEcharts from 'echarts-for-react';
import echarts from 'echarts';
主题自定义JS:
到官网进行下载主题颜色的json,js
https://echarts.baidu.com/theme-builder/
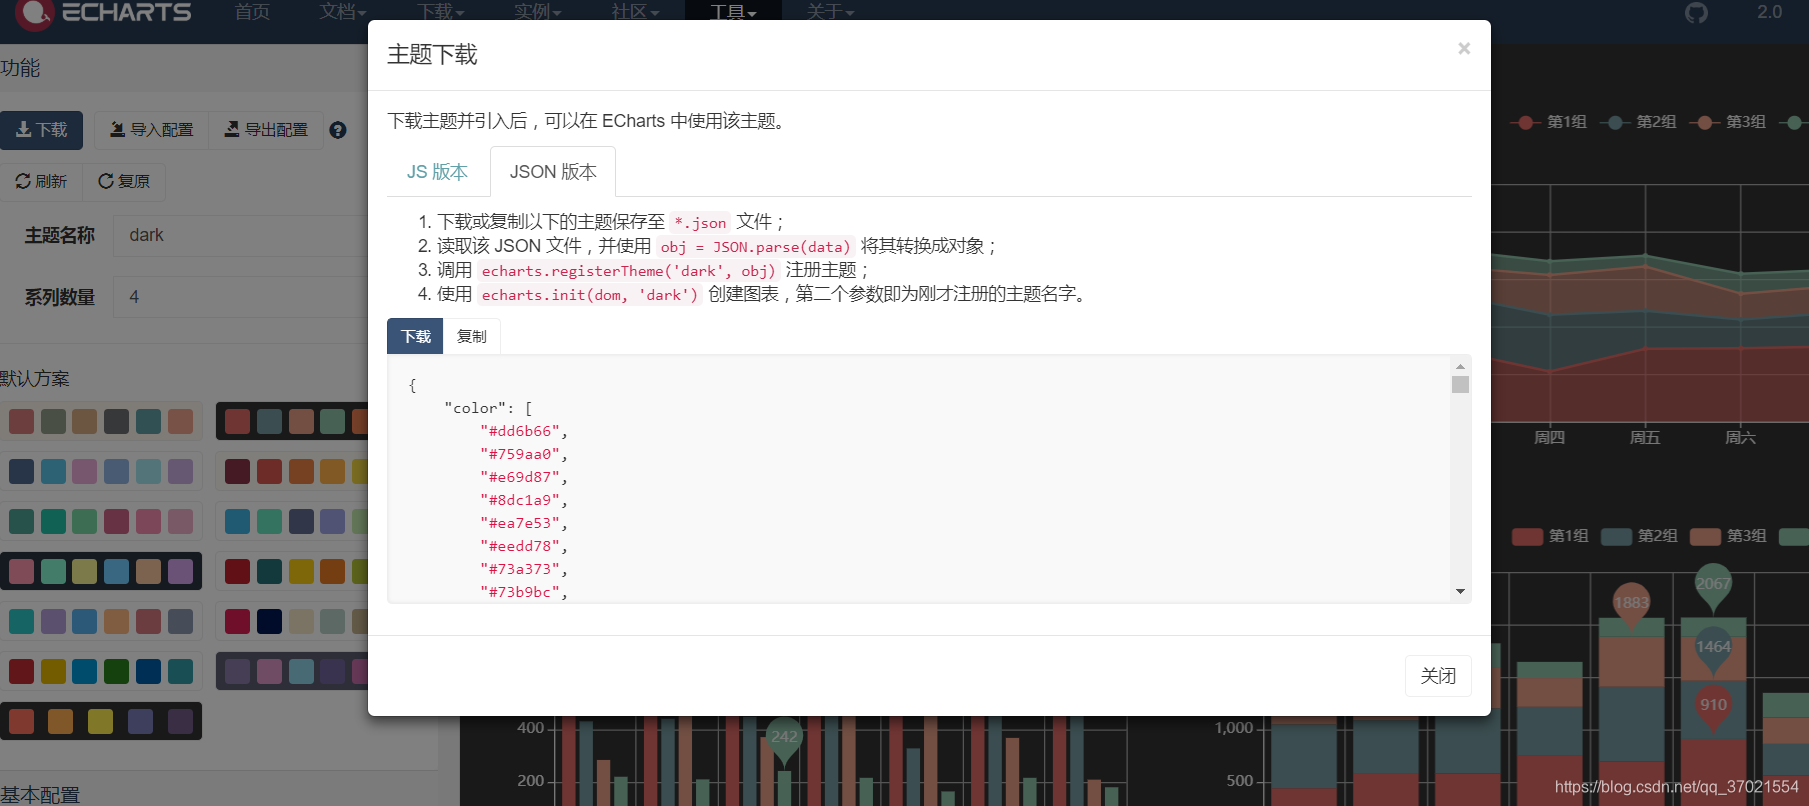
选择相应的
echartsTheme.js
export default{
"color": [
"#3fb1e3",
"#6be6c1",
"#626c91",
"#a0a7e6",
"#c4ebad",
"#96dee8"
],
"backgroundColor": "rgba(252,252,252,0)",
"textStyle": {},
"title": {
"textStyle": {
"color": "#666666"
},
"subtextStyle": {
"color": "#999999"
}
},
"line": {
"itemStyle": {
"normal": {
"borderWidth": "2"
}
},
"lineStyle": {
"normal": {
"width": "3"
}
},
"symbolSize": "8",
"symbol": "emptyCircle",
"smooth": false
},
"radar": {
"itemStyle": {
"normal": {
"borderWidth": "2"
}
},
"lineStyle": {
"normal": {
"width": "3"
}
},
"symbolSize": "8",
"symbol": "emptyCircle",
"smooth": false
},
"bar": {
"itemStyle": {
"normal": {
"barBorderWidth": 0,
"barBorderColor": "#ccc"
},
"emphasis": {
"barBorderWidth": 0,
"barBorderColor": "#ccc"
}
}
},
"pie": {
"itemStyle": {
"normal": {
"borderWidth": 0,
"borderColor": "#ccc"
},
"emphasis": {
"borderWidth": 0,
"borderColor": "#ccc"
}
}
},
"scatter": {
"itemStyle": {
"normal": {
"borderWidth": 0,
"borderColor": "#ccc"
},
"emphasis": {
"borderWidth": 0,
"borderColor": "#ccc"
}
}
},
"boxplot": {
"itemStyle": {
"normal": {
"borderWidth": 0,
"borderColor": "#ccc"
},
"emphasis": {
"borderWidth": 0,
"borderColor": "#ccc"
}
}
},
"parallel": {
"itemStyle": {
"normal": {
"borderWidth": 0,
"borderColor": "#ccc"
},
"emphasis": {
"borderWidth": 0,
"borderColor": "#ccc"
}
}
},
"sankey": {
"itemStyle": {
"normal": {
"borderWidth": 0,
"borderColor": "#ccc"
},
"emphasis": {
"borderWidth": 0,
"borderColor": "#ccc"
}
}
},
"funnel": {
"itemStyle": {
"normal": {
"borderWidth": 0,
"borderColor": "#ccc"
},
"emphasis": {
"borderWidth": 0,
"borderColor": "#ccc"
}
}
},
"gauge": {
"itemStyle": {
"normal": {
"borderWidth": 0,
"borderColor": "#ccc"
},
"emphasis": {
"borderWidth": 0,
"borderColor": "#ccc"
}
}
},
"candlestick": {
"itemStyle": {
"normal": {
"color": "#e6a0d2",
"color0": "transparent",
"borderColor": "#e6a0d2",
"borderColor0": "#3fb1e3",
"borderWidth": "2"
}
}
},
"graph": {
"itemStyle": {
"normal": {
"borderWidth": 0,
"borderColor": "#ccc"
}
},
"lineStyle": {
"normal": {
"width": "1",
"color": "#cccccc"
}
},
"symbolSize": "8",
"symbol": "emptyCircle",
"smooth": false,
"color": [
"#3fb1e3",
"#6be6c1",
"#626c91",
"#a0a7e6",
"#c4ebad",
"#96dee8"
],
"label": {
"normal": {
"textStyle": {
"color": "#ffffff"
}
}
}
},
"map": {
"itemStyle": {
"normal": {
"areaColor": "#eeeeee",
"borderColor": "#aaaaaa",
"borderWidth": 0.5
},
"emphasis": {
"areaColor": "rgba(63,177,227,0.25)",
"borderColor": "#3fb1e3",
"borderWidth": 1
}
},
"label": {
"normal": {
"textStyle": {
"color": "#ffffff"
}
},
"emphasis": {
"textStyle": {
"color": "rgb(63,177,227)"
}
}
}
},
"geo": {
"itemStyle": {
"normal": {
"areaColor": "#eeeeee",
"borderColor": "#aaaaaa",
"borderWidth": 0.5
},
"emphasis": {
"areaColor": "rgba(63,177,227,0.25)",
"borderColor": "#3fb1e3",
"borderWidth": 1
}
},
"label": {
"normal": {
"textStyle": {
"color": "#ffffff"
}
},
"emphasis": {
"textStyle": {
"color": "rgb(63,177,227)"
}
}
}
},
"categoryAxis": {
"axisLine": {
"show": true,
"lineStyle": {
"color": "#cccccc"
}
},
"axisTick": {
"show": false,
"lineStyle": {
"color": "#333"
}
},
"axisLabel": {
"show": true,
"textStyle": {
"color": "#999999"
}
},
"splitLine": {
"show": true,
"lineStyle": {
"color": [
"#eeeeee"
]
}
},
"splitArea": {
"show": false,
"areaStyle": {
"color": [
"rgba(250,250,250,0.05)",
"rgba(200,200,200,0.02)"
]
}
}
},
"valueAxis": {
"axisLine": {
"show": true,
"lineStyle": {
"color": "#cccccc"
}
},
"axisTick": {
"show": false,
"lineStyle": {
"color": "#333"
}
},
"axisLabel": {
"show": true,
"textStyle": {
"color": "#999999"
}
},
"splitLine": {
"show": true,
"lineStyle": {
"color": [
"#eeeeee"
]
}
},
"splitArea": {
"show": false,
"areaStyle": {
"color": [
"rgba(250,250,250,0.05)",
"rgba(200,200,200,0.02)"
]
}
}
},
"logAxis": {
"axisLine": {
"show": true,
"lineStyle": {
"color": "#cccccc"
}
},
"axisTick": {
"show": false,
"lineStyle": {
"color": "#333"
}
},
"axisLabel": {
"show": true,
"textStyle": {
"color": "#999999"
}
},
"splitLine": {
"show": true,
"lineStyle": {
"color": [
"#eeeeee"
]
}
},
"splitArea": {
"show": false,
"areaStyle": {
"color": [
"rgba(250,250,250,0.05)",
"rgba(200,200,200,0.02)"
]
}
}
},
"timeAxis": {
"axisLine": {
"show": true,
"lineStyle": {
"color": "#cccccc"
}
},
"axisTick": {
"show": false,
"lineStyle": {
"color": "#333"
}
},
"axisLabel": {
"show": true,
"textStyle": {
"color": "#999999"
}
},
"splitLine": {
"show": true,
"lineStyle": {
"color": [
"#eeeeee"
]
}
},
"splitArea": {
"show": false,
"areaStyle": {
"color": [
"rgba(250,250,250,0.05)",
"rgba(200,200,200,0.02)"
]
}
}
},
"toolbox": {
"iconStyle": {
"normal": {
"borderColor": "#999999"
},
"emphasis": {
"borderColor": "#666666"
}
}
},
"legend": {
"textStyle": {
"color": "#999999"
}
},
"tooltip": {
"axisPointer": {
"lineStyle": {
"color": "#cccccc",
"width": 1
},
"crossStyle": {
"color": "#cccccc",
"width": 1
}
}
},
"timeline": {
"lineStyle": {
"color": "#626c91",
"width": 1
},
"itemStyle": {
"normal": {
"color": "#626c91",
"borderWidth": 1
},
"emphasis": {
"color": "#626c91"
}
},
"controlStyle": {
"normal": {
"color": "#626c91",
"borderColor": "#626c91",
"borderWidth": 0.5
},
"emphasis": {
"color": "#626c91",
"borderColor": "#626c91",
"borderWidth": 0.5
}
},
"checkpointStyle": {
"color": "#3fb1e3",
"borderColor": "rgba(63,177,227,0.15)"
},
"label": {
"normal": {
"textStyle": {
"color": "#626c91"
}
},
"emphasis": {
"textStyle": {
"color": "#626c91"
}
}
}
},
"visualMap": {
"color": [
"#2a99c9",
"#afe8ff"
]
},
"dataZoom": {
"backgroundColor": "rgba(255,255,255,0)",
"dataBackgroundColor": "rgba(222,222,222,1)",
"fillerColor": "rgba(114,230,212,0.25)",
"handleColor": "#cccccc",
"handleSize": "100%",
"textStyle": {
"color": "#999999"
}
},
"markPoint": {
"label": {
"normal": {
"textStyle": {
"color": "#ffffff"
}
},
"emphasis": {
"textStyle": {
"color": "#ffffff"
}
}
}
}
}
可以复制json的再写js中export default 默认导出对象
再引入注册
import echartsTheme from './echartsTheme'


componentWillMount(){
     echarts.registerTheme('theme', echartsTheme);
}
最后在相应你想变主题颜色的表格上加上
                <Card title="柱形图表之一">
                    <ReactEcharts option={this.option} theme="theme" notMerge={true} lazyUpdate={true} style={{ height: 500 }}></ReactEcharts>
                </Card>
                <Card title="柱形图表之二" style={{marginTop:10}}>
                    <ReactEcharts option={this.option2}  theme="theme" notMerge={true} lazyUpdate={true} style={{ height: 500 }} />
                </Card>
theme上绑定 这样可以每一个图表都设置不同的theme
效果:
