react中使用Echarts
一. 第一种方式(推荐)
1.安装
npm i echarts -S
npm i react-for-echarts -S
2.去echarts官网下载主题
echarts官方主题
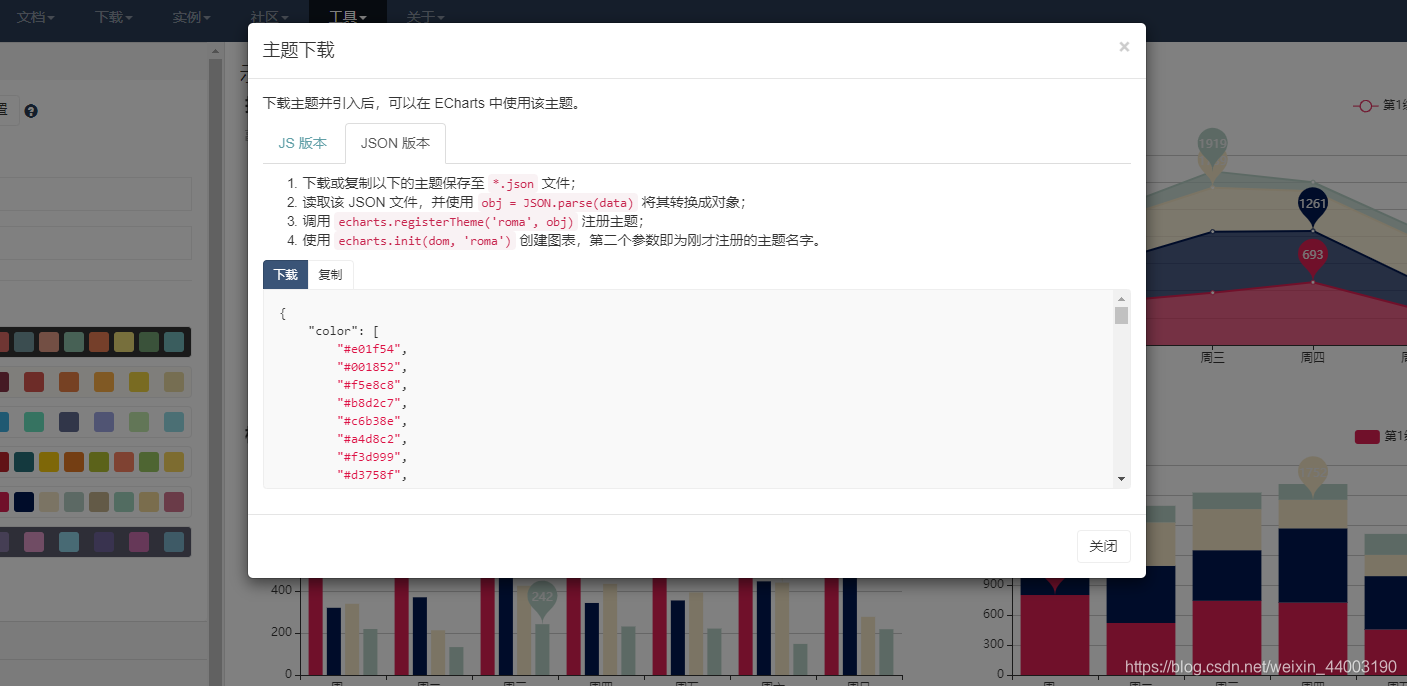
一定要选择json文件,因为默认是amd方式,而react是组件化,支持es6的模块化导入。
将json文件改成js文件即可,以下简称 echartsTheme.js
export default {
json文件
}
3. 使用
- 按需导入
import React from 'react'

import ReactEcharts from 'echarts-for-react';
import echartTheme from '@/lib/echartsTheme'
// 引入 ECharts 主模块
import echarts from 'echarts/lib/echarts'
// 引入饼图
import 'echarts/lib/chart/bar'
// 引入提示框和标题组件
import 'echarts/lib/component/tooltip';
import 'echarts/lib/component/title';
import 'echarts/lib/component/legend';
import 'echarts/lib/component/markPoint';
- 渲染主题(不要用DidMount)
componentWillMount(){
        echarts.registerTheme('myTheme',echartTheme);
}
- 配置option
因为react-for-echarts已经帮我们封装了option的配置项,我们只需将option传入即可
	getOption(){
        let option = {
            title: {
                text: '网站访问统计'
            },
            tooltip : {
                trigger: 'axis'
            },
            xAxis: {
                data: [
                    '周一',
                    '周二',
                    '周三',
                    '周四',
                    '周五',
                    '周六',
                    '周日'
                ]
            },
            yAxis: {
                type: 'value'
            },
            series: [
                {
                    name: '订单量',
                    type: 'bar',
                    data: [
                        1000,
                        2000,
                        1500,
                        3000,
                        2000,
                        1200,
                        800
                    ]
                }
            ]
     }
        return option;
}

    render(){
        return (
            <div>
                <Card title="柱形图表之一" >
                    <ReactEcharts option={this.getOption()} theme="myTheme" notMerge={true} lazyUpdate={true} style={{ height: 500 }} />
                </Card>
            </div>
        );
	}
具体实例可以去官网看
二.第二种方式
1.安装
npm i echarts -S
2.使用
- 直接导入
import React from 'react'

// 引入 ECharts 主模块
import echarts from 'echarts/lib/echarts'
// 引入饼图
import 'echarts/lib/chart/bar'
// 引入提示框和标题组件
import 'echarts/lib/component/tooltip';
import 'echarts/lib/component/title';
import 'echarts/lib/component/legend';
import 'echarts/lib/component/markPoint';
- 实例化echarts
 componentDidMount() {
        // 基于准备好的dom,初始化echarts实例
        var myChart = echarts.init(document.getElementById('main'));
        // 绘制图表
        myChart.setOption({
            title: { text: 'ECharts 入门示例' },
            tooltip: {},
            xAxis: {
                data: ["衬衫", "羊毛衫", "雪纺衫", "裤子", "高跟鞋", "袜子"]
            },
            yAxis: {},
            series: [{
                name: '销量',
                type: 'bar',
                data: [5, 20, 36, 10, 10, 20]
            }]
        });
    }
- 使用
render() {
        return (
            <div id="main" style={{ width: 400, height: 400 }}></div>
        );
}