最近开始学习Python编程,遇到scatter函数,感觉里面的参数不知道什么意思于是查资料,最后总结如下:
1、scatter函数原型
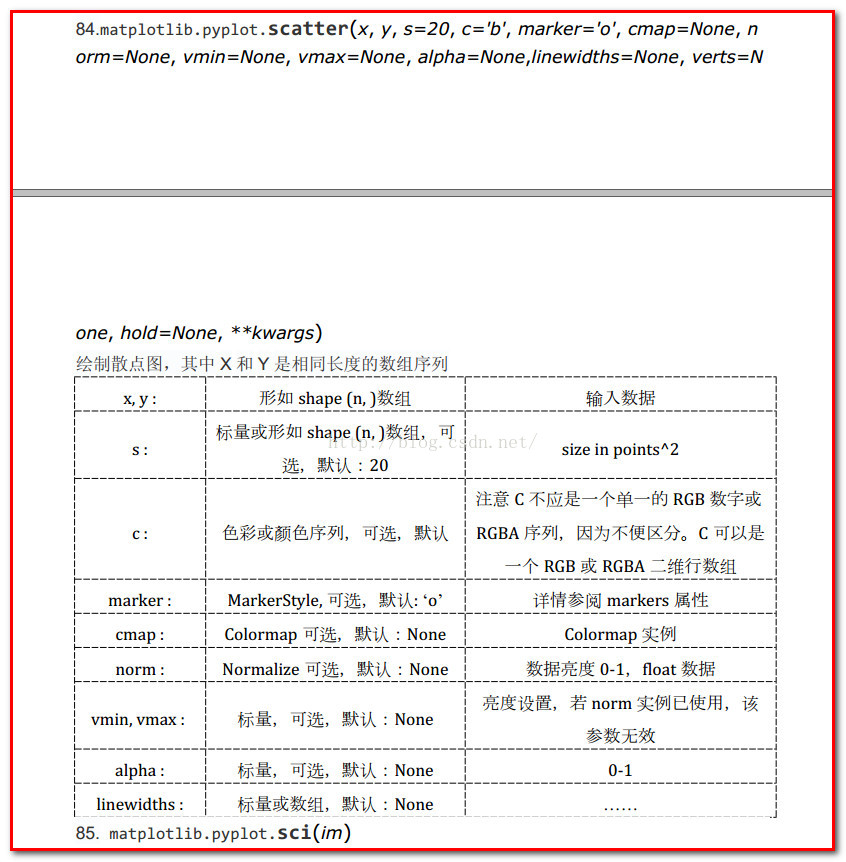
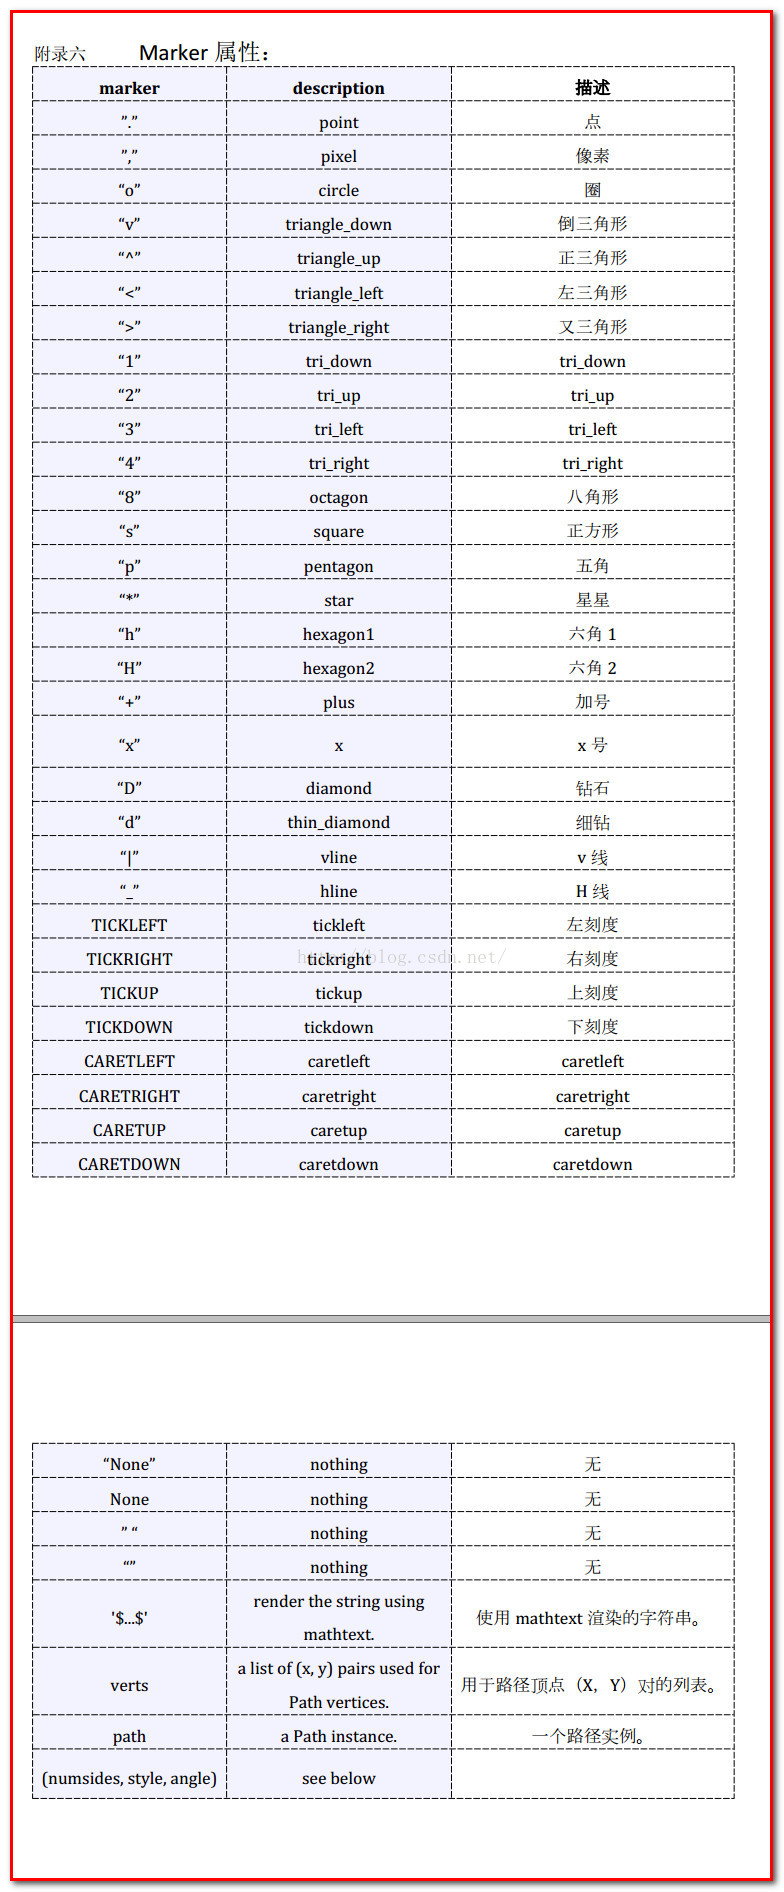
2、其中散点的形状参数marker如下:
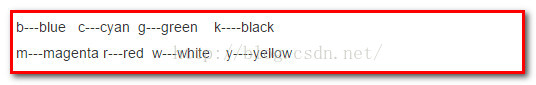
3、其中颜色参数c如下:
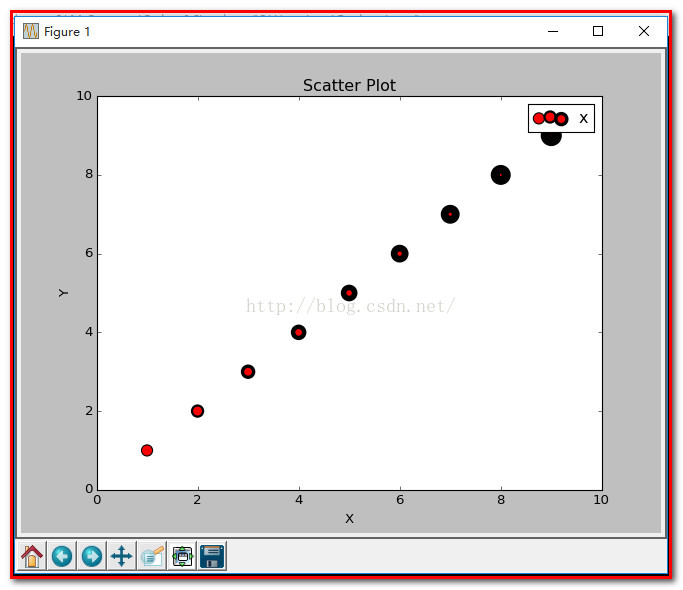
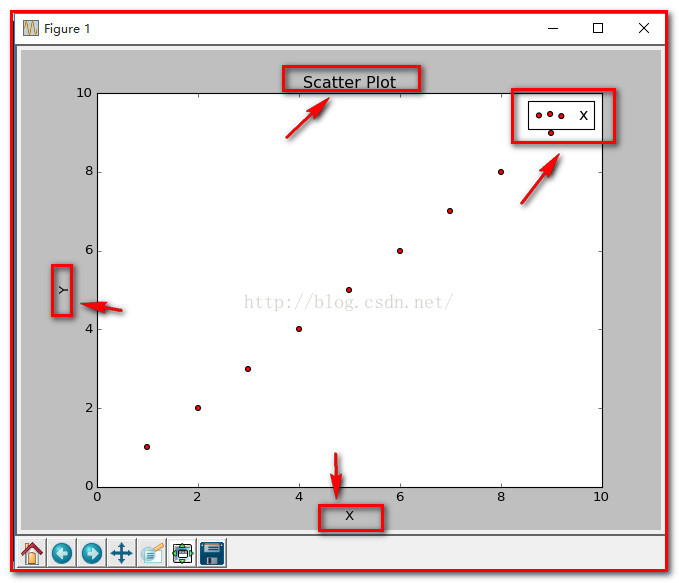
4、基本的使用方法如下:
- #导入必要的模块
- import numpy as np
- import matplotlib.pyplot as plt
- #产生测试数据
- x = np.arange(1,10)
- y = x
- fig = plt.figure()
- ax1 = fig.add_subplot(111)
- #设置标题
- ax1.set_title('Scatter Plot')
- #设置X轴标签
- plt.xlabel('X')
- #设置Y轴标签
- plt.ylabel('Y')
- #画散点图
- ax1.scatter(x,y,c = 'r',marker = 'o')
- #设置图标
- plt.legend('x1')
- #显示所画的图
- plt.show()
结果如下:
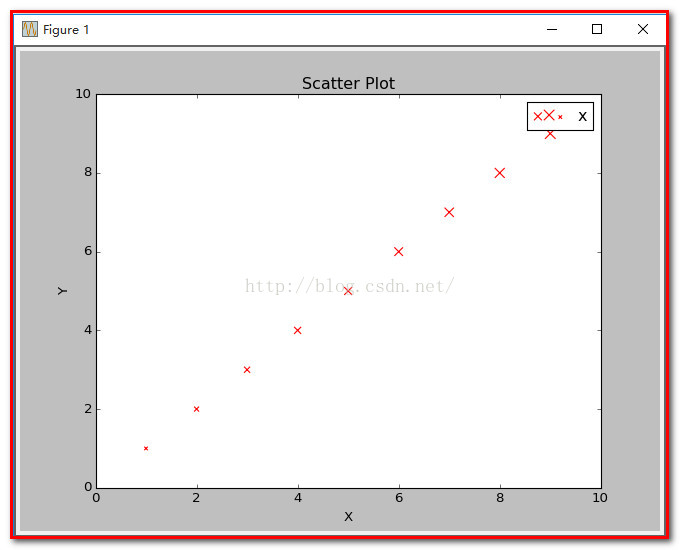
5、当scatter后面参数中数组的使用方法,如s,当s是同x大小的数组,表示x中的每个点对应s中一个大小,其他如c,等用法一样,如下:
扫描二维码关注公众号,回复:
5444759 查看本文章

(1)、不同大小
- #导入必要的模块
- import numpy as np
- import matplotlib.pyplot as plt
- #产生测试数据
- x = np.arange(1,10)
- y = x
- fig = plt.figure()
- ax1 = fig.add_subplot(111)
- #设置标题
- ax1.set_title('Scatter Plot')
- #设置X轴标签
- plt.xlabel('X')
- #设置Y轴标签
- plt.ylabel('Y')
- #画散点图
- sValue = x*10
- ax1.scatter(x,y,s=sValue,c='r',marker='x')
- #设置图标
- plt.legend('x1')
- #显示所画的图
- plt.show()
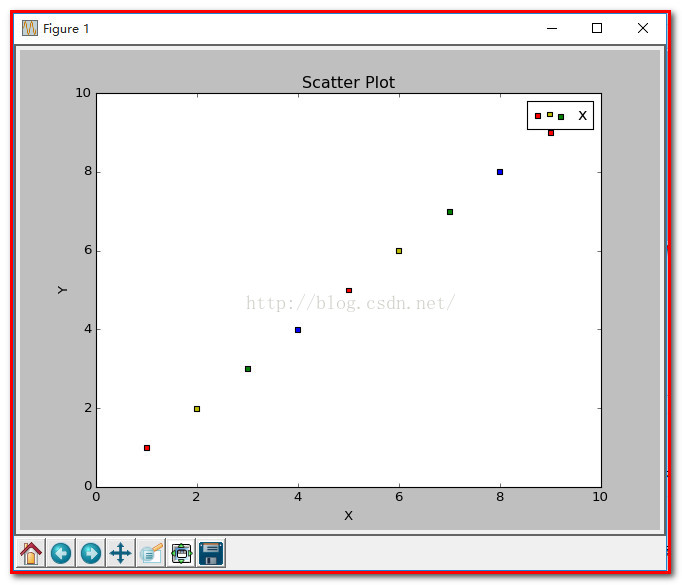
(2)、不同颜色
- #导入必要的模块
- import numpy as np
- import matplotlib.pyplot as plt
- #产生测试数据
- x = np.arange(1,10)
- y = x
- fig = plt.figure()
- ax1 = fig.add_subplot(111)
- #设置标题
- ax1.set_title('Scatter Plot')
- #设置X轴标签
- plt.xlabel('X')
- #设置Y轴标签
- plt.ylabel('Y')
- #画散点图
- cValue = ['r','y','g','b','r','y','g','b','r']
- ax1.scatter(x,y,c=cValue,marker='s')
- #设置图标
- plt.legend('x1')
- #显示所画的图
- plt.show()
结果:
(3)、线宽linewidths
- #导入必要的模块
- import numpy as np
- import matplotlib.pyplot as plt
- #产生测试数据
- x = np.arange(1,10)
- y = x
- fig = plt.figure()
- ax1 = fig.add_subplot(111)
- #设置标题
- ax1.set_title('Scatter Plot')
- #设置X轴标签
- plt.xlabel('X')
- #设置Y轴标签
- plt.ylabel('Y')
- #画散点图
- lValue = x
- ax1.scatter(x,y,c='r',s= 100,linewidths=lValue,marker='o')
- #设置图标
- plt.legend('x1')
- #显示所画的图
- plt.show()