1. 基本绘画设置
(1) Figure和Subplot
matplotlib的图像都位于Figure对象中,你可以用plt.figure创建一个新的Figure.
#这时会弹出一个空窗
fig = plt.figure()
但是不能通过空Figure绘图,必须用add_subplot创建一个或多个subplot才行
#这条代码的意思是:图像应该是2X2的,且当前选中的是第一个
ax1 = fig.add_subplot(2,2,1)

#再绘制两个
ax2 = fig.add_subplot(2,2,2)
ax3 = fig.add_subplot(2,2,3)
此时绘图,就会在subplot上进行绘制
例如:
from numpy.random import randn
plt.plot(randn(50).cumsum(), 'k--')
#'k--'是一个线型选项,用于告诉matplotlib绘制黑色虚线图。
别一种更为方便的方法,可以创建一个新的Figure,并返回一个含有已创建subplot对象的NumPy数组:
#创建了一个两行,三列的区域
fig, axes = plt.subplots(2,3)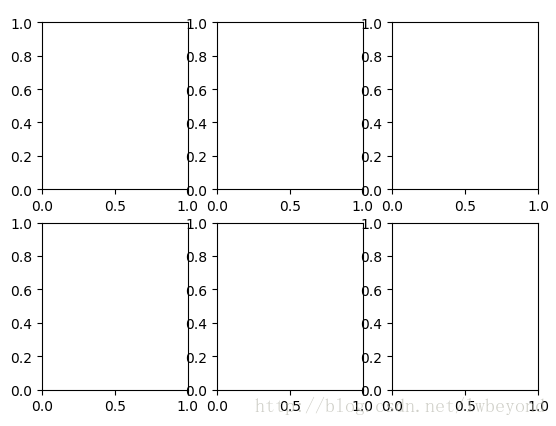
(2) 调整subplot周围的间距
默认情况下,matplotlib会在subplot外围留下一定的边距,并在subplot之间留下一定的间距。
利用subplots_adjust方法可以调整间距
fig, axes = plt.subplots(2,2, sharex=True, sharey=True)
for i in range(2):
    for j in range(2):
        axes[i,j].hist(randn(500), bins=50, color='k', alpha=0.5)

plt.subplots_adjust(wspace=0, hspace=0)

(3) 颜色、标记和线型
根据x,y绘制绿色虚线
ax.plot(x, y, 'g--')
#与下面设置是一样的
ax.plot(x, y, linestyle='--', color='g')
线型图可以加上一些标记,来强调实际的点
plt.plot(randn(30).cumsum(), 'ko--')
#等价于
plt.plot(randn(30).cumsum(), color='k', linestyle='dashed', marker='o')
(4) 刻度、标签和图例
添加刻度和标签
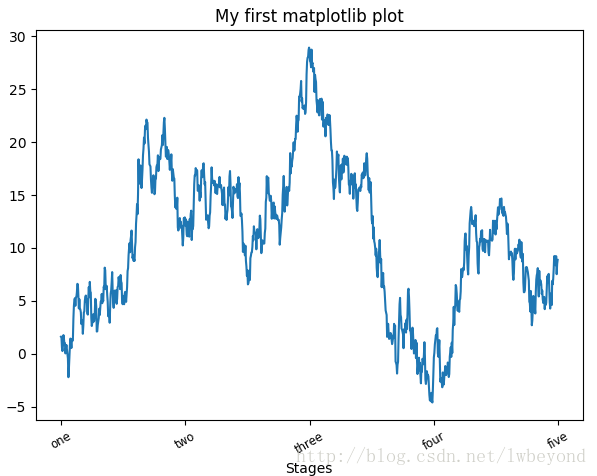
fig = plt.figure()
ax = fig.add_subplot(1,1,1)
ax.plot(randn(1000).cumsum())

#修改X轴的刻度
#刻度放在哪些位置
ticks = ax.set_xticks([0,250,500,750,1000])
#也可以将其他值用作标签
labels = ax.set_xticklabels(['one','two','three','four','five'], rotation=30, fontsize='small')

#为X轴设置一个名称
ax.set_title('My first matplotlib plot')
#设置一个标题
ax.set_xlabel('Stages')
添加图例:
fig = plt.figure()
ax = fig.add_subplot(1,1,1)
ax.plot(randn(1000).cumsum(), 'k', label='one')
ax.plot(randn(1000).cumsum(), 'k--', label='two')
ax.plot(randn(1000).cumsum(), 'k.', label='three')

ax.legend(loc='best')

2. cumsum函数定义:
cumsum(a, axis=None, dtype=None, out=None)
a.cumsum(axis=None, dtype=None, out=None)
返回:沿着指定轴的元素累加和所组成的数组,其形状应与输入数组a一致
其中cumsum函数的参数:
a:数组
axis:轴索引,整型,若a为n维数组,则axis的取值范围为[0,n-1]
dtype:返回结果的数据类型,若不指定,则默认与a一致。
out:数据类型为数组。用来放置结果的替代输出数组,它必须具有与输出结果具有相同的形状和缓冲长度
代码示例:
1.对于一维数组而言:
import numpy as np

arr=np.array([1,2,3,4,5,6,7,8,9])

result=arr.cumsum()    #此时axis只能取0,因此,axis=0可不写

#result: array([ 1,  3,  6, 10, 15, 21, 28, 36, 45], dtype=int32)
输出结果的数组result[i]的结果为sum(arr[:i+1])。
2.对于二维数组而言
import numpy as np

arr=np.array([[1,2,3],[4,5,6],[7,8,9]])

#沿着axis=0轴计算

result1=arr.cumsum(0)   #array([[ 1,  2,  3],[ 5,  7,  9],[12, 15, 18]], dtype=int32)

#沿着axis=1轴计算

result2=arr.cumsum(1)   #array([[ 1,  3,  6],[ 4,  9, 15],[ 7, 15, 24]], dtype=int32)

#arr.cumsum()并不是arr.cumsum(0)和arr.cumsum(1)的并集,而是将arr重塑为一维数组后的,再计算cumsum()的结果

arr.cumsum()#array([ 1,  3,  6, 10, 15, 21, 28, 36, 45], dtype=int32)
输出结果的数组result1[i][j]的结果为sum(arr[:i+1,j]);
输出结果的数组result2[i][j]的结果为sum(arr[i,:j+1])。
本文参考了 Python进阶 -- 1. matplotlib 和 python学习之numpy中的cumsum函数、tile函数