Scikit-Learn的评估器API遵照以下设计原则:
- 统一性
- 内省
- 限制对象层级
- 函数组合
- 明智的默认值
使用Scikit-Learn评估器API训练模型的常用步骤:
一. 通过从Scikit-Learn中导入适当的模型评估器, 选择模型类
如从线性模型中选择线性回归模型
from sklearn.linear_model import LinearRegression
ps. sklearn是scikit-learn在python程序中的包名
二. 用合适的数值对模型类进行实例化, 配置模型超参数
超参数: hyperparameter
超参数指的是在模型拟合数据之前必须被确定的参数. 在Scikit-Learn中, 通常在模型初始化阶段选择超参数
如这个线性回归模型中
model = LinearRegression(fit_intercept=True)
fit_intercept 参数代表是否要拟合直线的截距
三. 整理数据, 获取特征矩阵和目标数组
要训练模型, 当然需要训练数据. 这个过程就是获取数据, 并将数据格式化.
import numpy as np
rng = np.random.RandomState(42)
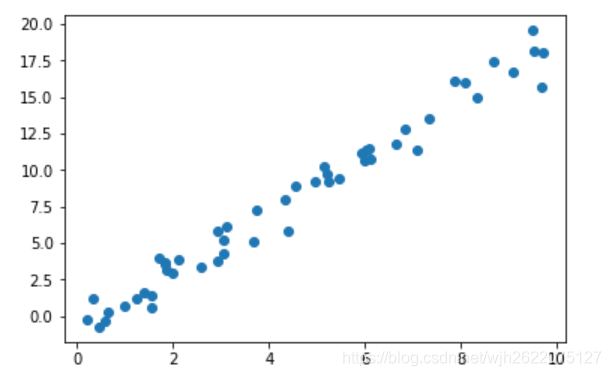
x = 10 * rng.rand(50)
y = 2 * x - 1 + rng.randn(50)
我们随机化生成了一些数据, 作为训练数据, 这些数据可视化图形如下图
我们还需要把X转化为列向量
X = x[:, np.newaxis]
四. 调用模型实例的fit()方法对数据进行拟合
model.fit(X, y)
拟合结束后, 我们可以查看拟合得到的直线的斜率以及截距.
model.coef_ # 斜率
model.intercept_ # 截距
五. 对新数据引用模型:
# 下面这行是我自己写的英语句子, 尴尬
In supervised learning model, we usually use the predict() method to predict the label of new data
# 这行句子用的谷歌翻译
In the unsupervised learning model, the transform() or predict() method is usually used to transform or infer the nature of the data.
代码表现上为
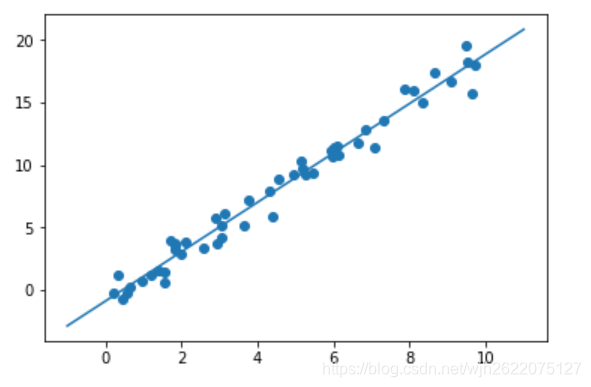
xfit = np.linspace(-1, 11) # 生成测试数据
Xfit = xfit[:, np.newaxis] # 格式化
yfit = model.predict(Xfit) # 预测
plt.scatter(x, y)
plt.plot(xfit, yfit) # 可视化
预测成功!

完整代码实现
#!/usr/bin/env python
# coding: utf-8

# In[14]:


get_ipython().run_line_magic('matplotlib', 'inline')
import matplotlib.pyplot as plt
import numpy as np

rng = np.random.RandomState(42)
x = 10 * rng.rand(50)
y = 2 * x - 1 + rng.randn(50)
plt.scatter(x, y)


# In[15]:


from sklearn.linear_model import LinearRegression


# In[16]:


model = LinearRegression(fit_intercept=True)
model


# In[18]:


X = x[:, np.newaxis]
X.shape


# In[19]:


model.fit(X, y)


# In[20]:


model.coef_


# In[21]:


model.intercept_


# In[22]:


xfit = np.linspace(-1, 11)
Xfit = xfit[:, np.newaxis]
yfit = model.predict(Xfit)


# In[23]:


plt.scatter(x, y)
plt.plot(xfit, yfit)
一些细节的学习
1-np.random.RandomState(42)是什么
参考
是和np.random.seed(42)类似的可以设置随机种子的类.
rng.rand(10)可生成10个[0, 1)之间的实数
2-plt.scatter(x, y)是画散点图的函数
3-X = x[:, np.newaxis]可以将一维行向量变为一维列向量
x = np.random.randint(10, size=10)
print(x)
X = x[:, np.newaxis]
print(X)
4-model.coef_与model.intercept_
截距的英文单词为intercept
coef为coefficient的缩写, 在此为系数.