Groupby Count
# Party’s Frequency of donations
nyc.groupby(’Party’)[’contb receipt amt’].count()
The command returns a series where the index is the name of a Party and the value is the count of that Party. Note that the series is ordered by the name of Party alphabetically.

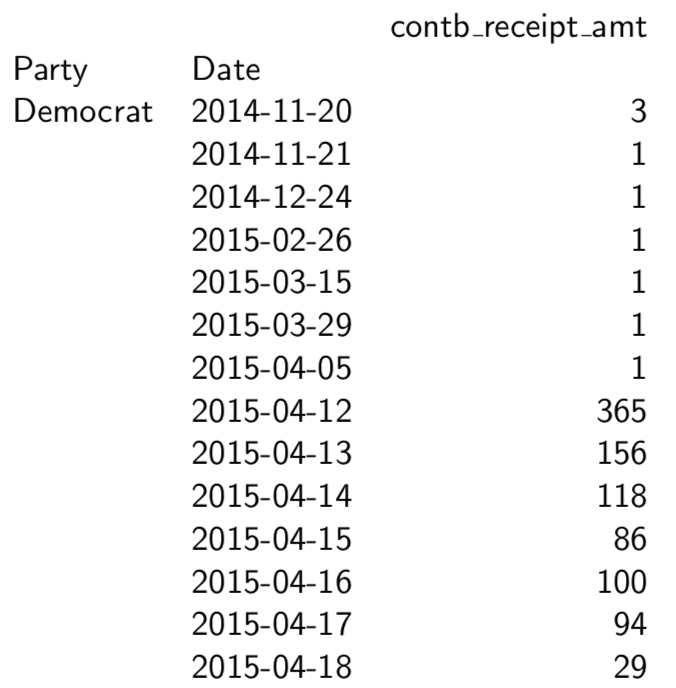
Multiple Variables
# Party’s Frequency of donations by Date
nyc.groupby([’Party’, ’Date’])[’contb receipt amt’].count()
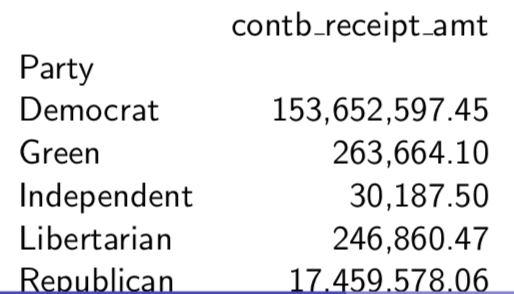
Groupby Sum
# Party’s Sum of donations
nyc.groupby(’Party’)[’contb receipt amt’].sum()

# Define the format of float
pd.options.display.float format = ’{:,.2f}’.format
nyc.groupby(’Party’)[’contb receipt amt’].sum()
Groupby Order
# Top 5 Donors, by Occupation
df7 = nyc.groupby(’contbr occupation’)[’contb receipt amt’]. sum(). reset  index ()
df7.sort_values(’contb receipt amt’, ascending=False, inplace =True)
df7.head(5)
#or
df7.nlargest(5,’contb receipt amt’)

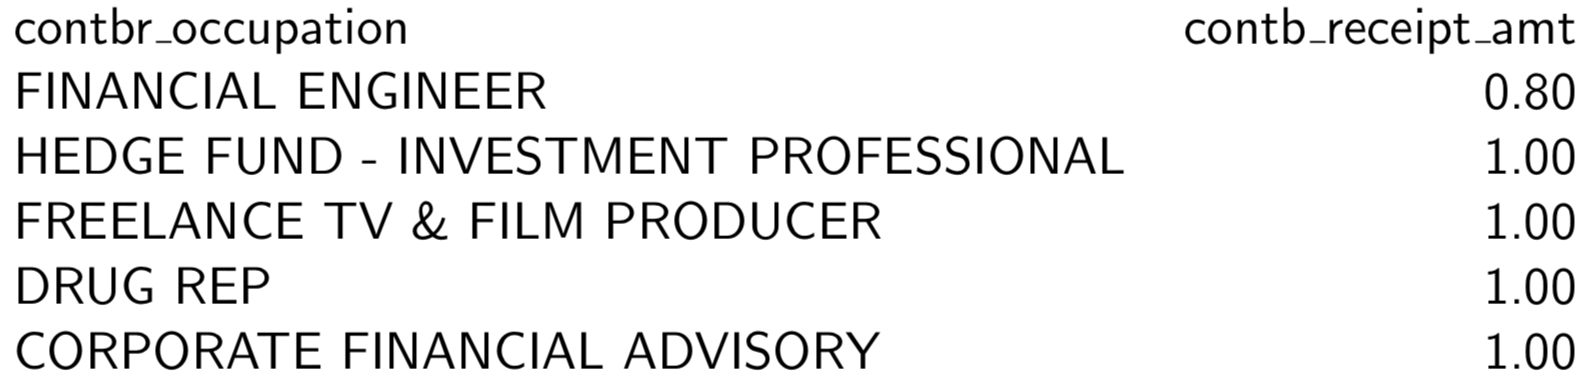
# Bottom 5 Donors, by Occupation
df8 = nyc.groupby(’contbr occupation’)[’contb receipt amt’]. sum() . reset   index ()
df8 . sort_values (by=’ contb receipt amt ’ , inplace=True) df8.head(5)
# OR
df7.tail(5)
#OR
df8.nsmallest(5,’contb receipt amt’)

Get rid of negative values:
df8 [ df8 . contb receipt amt >0].head(5)
扫描二维码关注公众号,回复:
5158558 查看本文章

The following commands give an example to find the Top 5 occupations that donated to each cadidate. Note that we need to sort the table based on two variables, firtly sorted by candidate name alphabetically and then sorted by contribution amount in a descending order. Finally, we hope to show the Top 5 occupations for each candidate.
# Top 5 Occupations that donated to Each Candidate
df10 = nyc.groupby ([ ’cand_nm’ , ’contbr_occupation’ ]) [ ’contb_receipt_amt’ ].sum().reset_index ()
df10.sort_values ([ ’cand_nm’ , ’contb_receipt_amt’ ] , ascending =[True , False ], inplace=True)
df10.groupby(’cand_nm’).head(5)
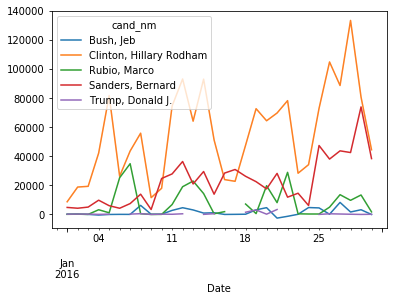
Groupby Plot
#Top 5 Fundraising Candidates Line Graph
df11 = nyc.groupby(’cand_nm’)[’contb_receipt_amt’].sum(). reset_index ()
df11_p = df11.nlargest(5,’contb_receipt_amt’)
df11_g = nyc[nyc.cand_nm.isin(df11_p.cand_nm)][[ ’cand_nm’,’Date’,’contb_receipt_amt’]]
dfpiv=pd.pivot table(df11_g , values=’contb_receipt_amt’, index=[’Date’],columns=[’cand_nm’], aggfunc=np.sum)
dfpiv.loc['2016-01-01':'2016−01−30'].plot.line()