Two Types of Estimation
- Point Estimate: the value of sample statistics
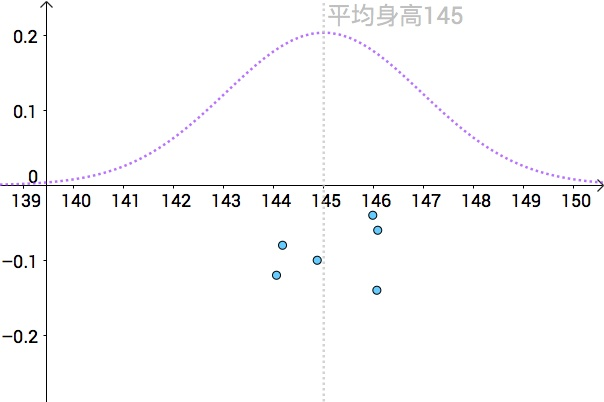
Point estimates of average height with multiple samples (Source: Zhihu)
- Confidence Intervals: intervals constructed using a method that contains the population parameter a specified proportion of the time.
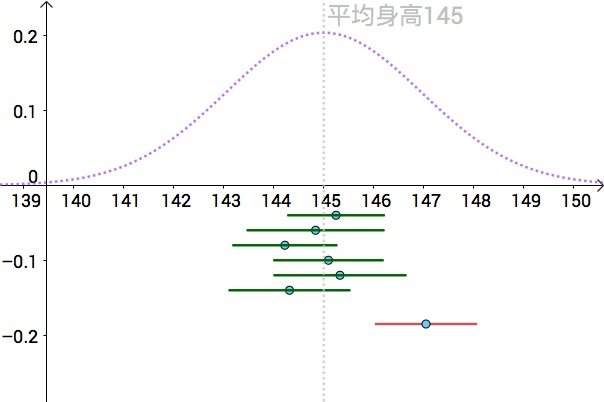
95% confidence interval of average height with multiple samples (Source: Zhihu)
Confidence Interval for the Mean
Population Variance is known
Suppose that M is the mean of N samples X1, X2, ......, Xn, i.e.

According to Central Limit Theorem, the the sampling distribution of the mean M is
![]()
where μ and σ2 are the mean and variance of the population respectively. If repeated samples were taken and the 95% confidence interval computed for each sample, 95% of the intervals would contain the population mean. So the 95% confidence interval for M is the inverval that is symetric about the point estimate μ so that the area under normal distribution is 0.95.
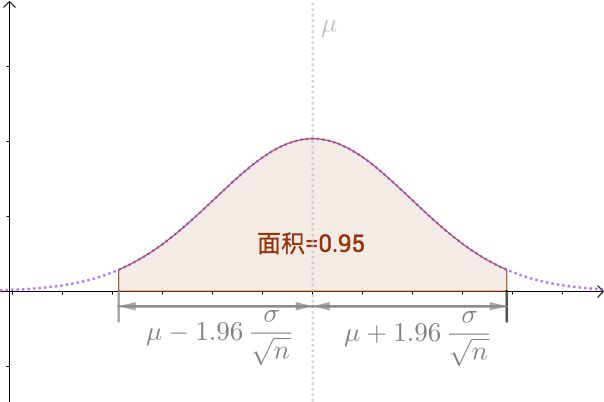
That is,
![]()
Since we don't know the mean of population, we could use the sample mean instead.
Population Variance is Unknown
Dregree of Freedom
The degrees of freedom (df) of an estimate is the number of independent pieces of information on which the estimate is based. In general, the degrees of freedom for an estimate is equal to the number of values minus the number of parameters estimated en route to the estimate in question.
If the variance in a sample is used to estimate the variance in a population, we couldn't calculate the sample variace as
![]()
That's because we have two parameters to estimate (i.e., sample mean and sample variance). The degree of freedom should be N-1, so the previous formula underestimates the variance. Instead, we should use the following formula
![]()
where s2 is the estimate of the variance and M is the sample mean. The denominator of this formula is the degree of freedom.
Student's t-Distribution
Suppose that X is a random variable of normal distribution, i.e., X ~ N(μ, σ2)
![]()
is sample mean and
![]()
is sample deviation.

is a random variable of normal distribution.

is a random variable of student's t distribution.
The probability density function of T is
![]()
where 

The t distribution is very similar to the normal distribution when the estimate of variance is based on many degrees of freedom, but has relatively more scores in its tails when there are fewer degrees of freedom. Here are t distributions with 2, 4, and 10 degrees of freedom and the standard normal distribution. Notice that the normal distribution has relatively more scores in the center of the distribution and the t distribution has relatively more in the tails.
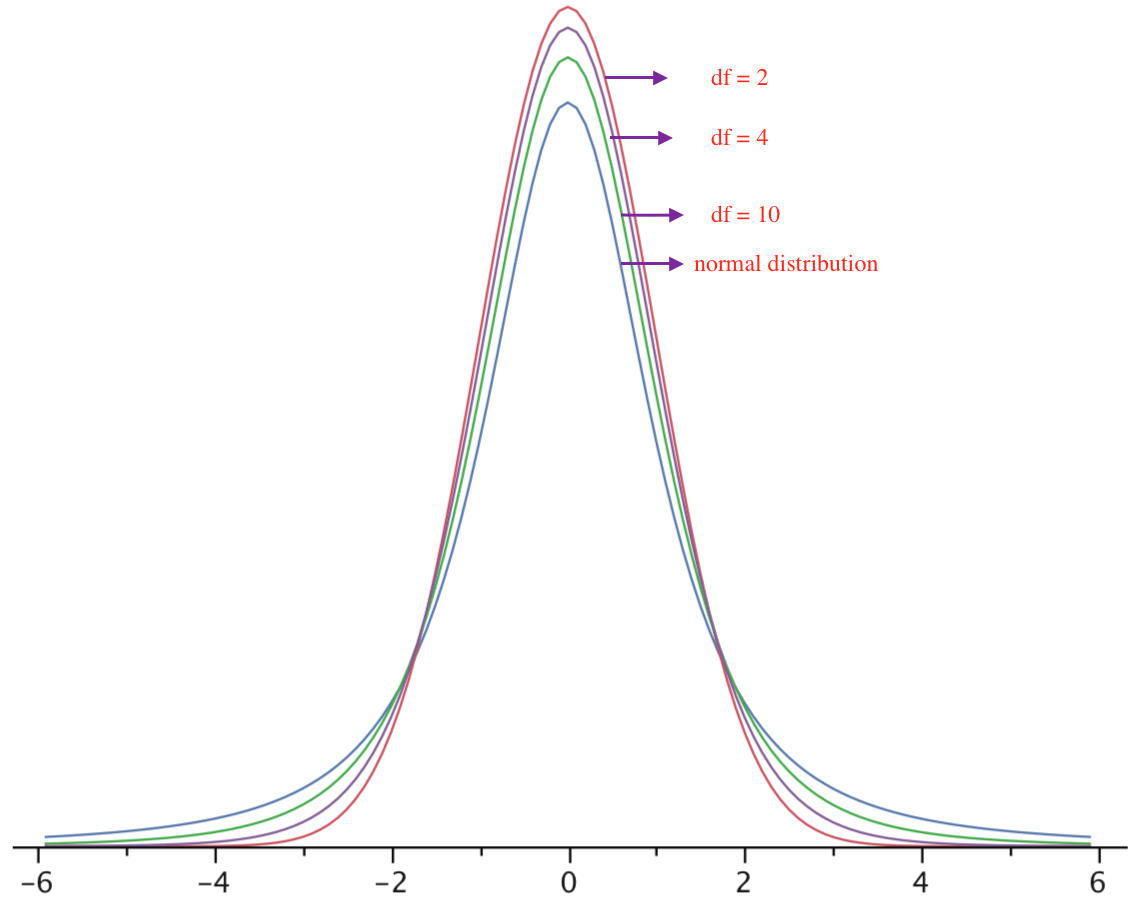
The t distribution is therefore leptokurtic. The t distribution approaches the normal distribution as the degrees of freedom increase.
Confidence Interval of t Distribution
Now consider the case in which you have a normal distribution but you do not know the standard deviation. You sample N values and compute the sample mean (M) and estimate the standard error of the mean (σM) with sM. What is the probability that M will be within 1.96 sM of the population mean (μ)? This is a difficult problem because there are two ways in which M could be more than 1.96 sM from μ: (1) M could, by chance, be either very high or very low and (2) sM could, by chance, be very low. Intuitively, it makes sense that the probability of being within 1.96 standard errors of the mean should be smaller than in the case when the standard deviation is known (and cannot be underestimated).
Luckily, however, we can prove that random variable T will be student's t distribution. So we can use t distribution to estimate the mean of a normal distribution population in situations where the sample size is small and population standard deviation is unknown. For 90% confidence interval, it can be calculated as
![]()
where A is value of T that contains 90% of the area of the t distribution for n-1 degree of freedom. We can calculate A through the t table.