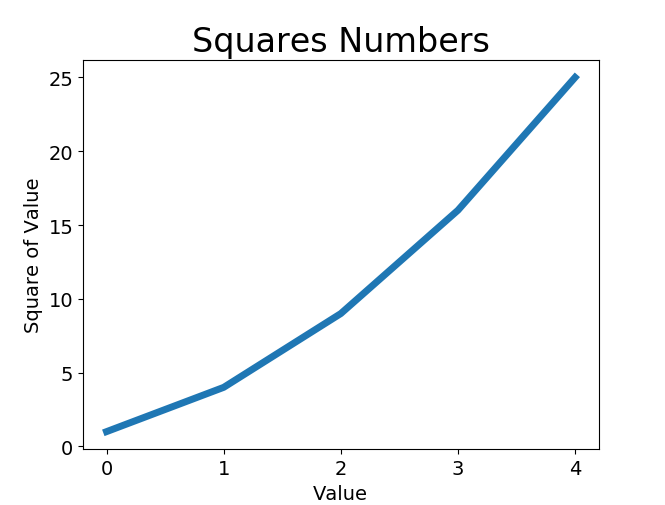
 1 import matplotlib.pyplot as plt
 2
 3 squares=[1,4,9,16,25]
 4 plt.plot(squares,linewidth=5)
 5 # 设置图表标题,并给坐标轴加上标签
 6 plt.title("Squares Numbers",fontsize=24)
 7 plt.xlabel("Value",fontsize=14)
 8 plt.ylabel("Square of Value",fontsize=14)
 9 # 设置刻度标记的大小
10 plt.tick_params(axis='both',labelsize=14)
11
12 plt.show()
 1 import matplotlib.pyplot as plt
 2
 3 input_values=[1,2,3,4,5]
 4 squares=[1,4,9,16,25]
 5 plt.plot(input_values,squares,linewidth=5)
 6 # 设置图表标题,并给坐标轴加上标签
 7 plt.title("Squares Numbers",fontsize=24)
 8 plt.xlabel("Value",fontsize=14)
 9 plt.ylabel("Square of Value",fontsize=14)
10 # 设置刻度标记的大小
11 plt.tick_params(axis='both',labelsize=14)
12
13 plt.show()

2018-04-2319:12:36