利用ELK构建一个小型日志收集平台
伴随着应用以及集群的扩展,查看日志的方式总是不方便,我们希望可以有一个便于我们查询及提醒功能的平台;那么首先需要剖析有几步呢?
格式定义 --> 日志收集 --> 运输 --> 存入 --> 查询
根据上面这几步,我们简单来设计一个收集平台,如下图:
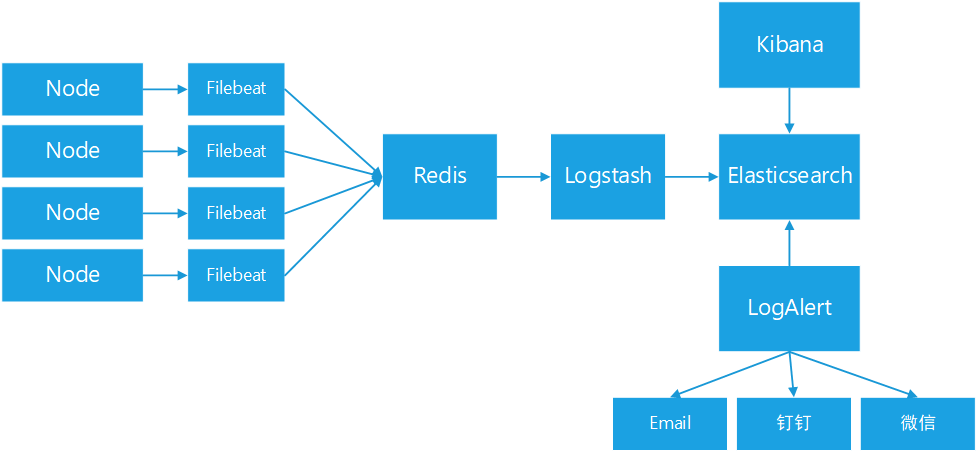
这里我们使用了Elastic Stack家族的Filebeat用作客户端收集,Kibana作为数据展示,Elasticsearch(后面简称ES)来存储日志,Logstash作为一个中转站帮助我们运输日志;同时我们还们还加入日志队列(这里使用Redis来担任)。
Filebeat以及Logstash自身带有队列功能,但是这里放置Redis可以做到解耦的功能,当然你也可以选择使用kafka这样的;至于Redis这边可以采用LB的模式来预防单点问题;
LogAlert是我们开发的专用于日志报警的工具,具体内容我们后面介绍。
整体软件环境说明:Filebeat、Kibana、Logstash、es均采用官方6.5.4的版本,请注意版本。
1、确定采集项目
我们简单梳理下采集项目如下:
- 系统日志 (Elastic Stack 有现成的模板)
- Message
- 审计日志
- 安全日志
- 开源组件 (绝大多数 Elastic Stack 有现成的模板)
- Nginx: 负载均衡,Web服务器;主要收集HTTP访问情况;
- Redis: 缓存组件;
- MySQL: 主要收集慢查询日志和常规日志;
- .... 等等
- Java应用 (比如自研发应用)
- 常规日志
- 业务日志
非常重要,一定要提前沟通规范日志格式,不然后期在进行改动推动非常的难,最后日志谁用就让谁定义格式;同时也要安利一波日志平台的好处,要不然怎么忽悠别人用呢,哈哈。

2、环境准备说明
这里呢,我将演示系统日志、Nginx日志、Redis日志、以及一个Java应用;采用系统为CentOS 7系统,如果未说明版本则不会影响我们的使用。
这里相关组件如Nginx、Redis我们采用最简单的Yum安装,别的需求可以自己定义。
3、采集节点日志(System,Nginx,Redis)
采集日志我们通过filebeat来搞,Filebeat比Logstash的一大优点是轻量级别,节省资源尤其是在云上我们很多情况下都是2核4G或者4核8G这样的机器,所以Filebeat作为客户端日志采集好处,balabala..... 我就不啰嗦了。(安装包请自行官网下载)
安装:
rpm -ivh filebeat-6.5.4-x86_64.rpm打开Module的支持:
Module是Filebeat预配置的日志收集,其原理也非常的简单,通过Input进行收集,然后通过es pipeline进行解析日志。
filebeat modules enable auditd nginx redis system调整配置配置文件:
        shell> cat /etc/filebeat/filebeat.yml
        filebeat.inputs:

        filebeat.config.modules:
          path: ${path.config}/modules.d/*.yml
          reload.enabled: false

        setup.template.settings:
          index.number_of_shards: 3

        setup.kibana:
          host: "localhost:5601"

        output.redis:
          hosts: ["localhost:6379"]
          password: "123456"
          key: "logs"
          db: 0
          timeout: 5

        processors:
          - add_host_metadata: ~
这里的配置说明是,配置redis的地址,以及KibanaAPI的地址;redis的配置我们需要简单调整下,调整如下:
shell> cat /etc/filebeat/modules.d/redis.yml
- module: redis
  # Main logs
  log:
    enabled: true

    # Set custom paths for the log files. If left empty,
    # Filebeat will choose the paths depending on your OS.
    var.paths: ["/var/log/redis/redis.log*"]

  # Slow logs, retrieved via the Redis API (SLOWLOG)
  slowlog:
    enabled: false

    # The Redis hosts to connect to.
    #var.hosts: ["localhost:6379"]

    # Optional, the password to use when connecting to Redis.
    #var.password:
可以看到,我们调整了Redis日志的路径,同时关闭了slowlog日志功能,当前版本还是测试,有兴趣的小伙伴可以研究一下,我这里就暂不使用。
启动服务:
shell> systemctl enable filebeat
shell> systemctl start filebeat
我们检查下Redis是否有日志存在
127.0.0.1:6379> LLEN logs
(integer) 5559
Ok, 至此我们通过Filebeat的Module快速收集了日志,接下来我们搞一个存储和Kibana了。
4、ES+Kibana部署
常规安装走一波:
首先我们需要看装JDK1.8的版本
shell> rpm -ivh jdk-8u191-linux-x64.rpm 安装部署ES
shell> rpm -ivh elasticsearch-6.5.4.rpm
shell> systemctl daemon-reload
shell> systemctl enable elasticsearch.service
shell> systemctl start elasticsearch.service
安装插件ingest-user-agent, ingest-geoip
shell> /usr/share/elasticsearch/bin/elasticsearch-plugin install file:///usr/local/src/ingest-user-agent-6.5.4.zip
shell> /usr/share/elasticsearch/bin/elasticsearch-plugin install file:///usr/local/src/ingest-geoip-6.5.4.zip
shell> systemctl restart elasticsearch
安装Kibana
shell> rpm -ivh kibana-6.5.4-x86_64.rpm
shell> systemctl enable kibana
shell> systemctl start kibana
然后可以Web查看一下,如果是其他机器请调整监听端口即可。

导入Filebeat模板与pipeline:
系统模板中,定义了非常多的字段属性,同时pipeline中定义的解析日志的规则;
导出默认的系统模板
shell> filebeat export template > filebeat.template.json
shell> sed -i '[email protected]@sys-log@g' filebeat.template.json   # 修改匹配索引
shell> curl -H 'Content-Type: application/json' -XPUT 'http://localhost:9200/_template/sys-log' [email protected]
导入modules到ES的pipline(导入前我们需要调整下,不然会有时区问题)
Nginx模块:
我们修改配置模板文件:/usr/share/filebeat/module/nginx/error/ingest/pipeline.json
原内容
                   "date": {
                      "field": "nginx.error.time",
                      "target_field": "@timestamp",
                      "formats": ["YYYY/MM/dd H:m:s"]
                    }
修改后
                  "date": {
                      "field": "nginx.error.time",
                      "target_field": "@timestamp",
                      "formats": ["YYYY/MM/dd H:m:s"],
                      "timezone" : "Asia/Shanghai"
                   }
Redis模块:
我们修改配置模板文件:/usr/share/filebeat/module/redis/log/ingest/pipeline.json
原内容
                    "date": {
                        "field": "redis.log.timestamp",
                        "target_field": "@timestamp",
                        "formats": ["dd MMM H:m:s.SSS", "dd MMM H:m:s", "UNIX"],
                        "ignore_failure": true
} 修改后
                    "date": {
                        "field": "redis.log.timestamp",
                        "target_field": "@timestamp",
                        "formats": ["dd MMM H:m:s.SSS", "dd MMM H:m:s", "UNIX"],
                        "ignore_failure": true,
                        "timezone" : "Asia/Shanghai"
                      }
系统模块:
我们编辑配置文件:/usr/share/filebeat/module/system/syslog/manifest.yml 打开时区的支持
原内容
          - name: convert_timezone
default: false 修改后
          - name: convert_timezone
            default: true
审计模块:
我们修改配置模板文件:/usr/share/filebeat/module/auditd/log/ingest/pipeline.json
原内容
                    "date": {
                        "field": "auditd.log.epoch",
                        "target_field": "@timestamp",
                        "formats": [
                            "UNIX"
                        ],
                        "ignore_failure": true
} 修改后
                    "date": {
                        "field": "auditd.log.epoch",
                        "target_field": "@timestamp",
                        "formats": [
                            "UNIX"
                        ],
                        "ignore_failure": true,
                        "timezone" : "Asia/Shanghai"
                    }
导入到ES系统之中:
shell> filebeat setup --modules nginx,redis,system,auditd --pipelines -e -E 'output.elasticsearch.hosts=["localhost:9200"]'这里可以通过ES API进行查询是否写入
es api> GET /_ingest/pipeline/这里会提示多个Out冲突,怎么办呢? 吧原先的Output注释掉即可,不用重启服务。
5、通过Logstash打通日志
安装
shell> rpm -ivh logstash-6.5.4.rpm配置一个pip
        shell> cat /etc/logstash/conf.d/sys-log.conf
        input {
          redis {
            host => "127.0.0.1"
            password => '123456'
            port => "6379"
            db => "0"
            data_type => "list"
            key => "logs"
          }
        }
        filter {
        }
        output {
          if [fileset][module] in ["system", "nginx", "redis", "mysql", "auditd"] {
            if [fileset][module] == "nginx" and [fileset][name] == "access" {
              elasticsearch {
                hosts => localhost
                index => "sys-log-%{+YYYY.MM.dd}"
                pipeline => "filebeat-6.5.4-%{[fileset][module]}-%{[fileset][name]}-default"
              }
            } else {
              elasticsearch {
                hosts => localhost
                index => "sys-log-%{+YYYY.MM.dd}"
                pipeline => "filebeat-6.5.4-%{[fileset][module]}-%{[fileset][name]}-pipeline"
              }
            }
          }
        }
启动测试
shell> systemctl enable logstash
shell> systemctl start logstash
可以通过Redis队列状态 或者 ES当前日志信息进行查询。
6、自定义收集项
Grok表达式:
\[%{DATA:svc}\] %{TIMESTAMP_ISO8601:time} %{LOGLEVEL:log.level} %{POSINT:process.pid} --- \[ *%{DATA:process.thread}\] %{DATA:process.class} *: %{GREEDYDATA:msg}配置系统日志索引模板:主要内容字段根据Grok表达式写入模板文件,模板文件根据系统模板修改而成。
将模板导入ES系统之中:
shell> curl -H 'Content-Type: application/json' -XPUT 'http://localhost:9200/_template/svc-log' [email protected]配置Filebeat抓取服务日志:(增加Input内容如下)
        - type: log
          paths:
            - /application/apps/*/server.log
          multiline.pattern: '^\['
          multiline.negate: true
          multiline.match: after
          fields:
            svc_type: java
具体配置信息,请了解官方信息。
配置Logstash解析格式
        input {
        ...
        }
        filter {
          if [fields][svc_type] == "java" {
            grok {
              match => { "message" => "\[%{DATA:svc}\] %{TIMESTAMP_ISO8601:time} +%{LOGLEVEL:log.level} %{POSINT:process.pid} --- \[ *%{DATA:process.thread}\] %{DATA:process.class} *: %{GREEDYDATA:msg}" }
                remove_field => "message"
              }
            date {
              match => [ "time", "ISO8601", "yyyy-MM-dd HH:mm:ss.SSS" ]
              remove_field => "time"
            }
            mutate {
              add_field => { "read_timestamp" => "%{@timestamp}" }
            }
          }
        }
        output {
          if [fields][svc_type] == "java" {
            elasticsearch {
              hosts => localhost
              index => "svc-log-%{+YYYY.MM.dd}"
            }
          }
        }
至此,我们简单的日志架构就已经完成了。