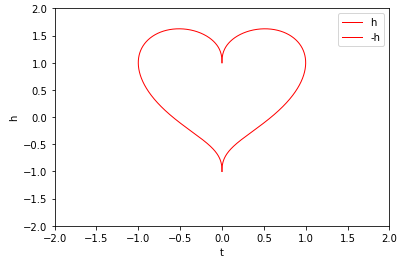
根据函数画出函数的轨迹
import math
t = np.linspace(0, math.pi, 1000)
x = np.sin(t)
y = np.cos(t) + np.power(x, 2.0/5)
plt.plot(x, y, color='red', linewidth=1, label='h')
plt.plot(-x, y, color='red', linewidth=1, label='-h')
plt.xlabel('t')
plt.ylabel('h')
plt.ylim(-2, 2)
plt.xlim(-2, 2)
plt.legend()
plt.show()