分段函数图像
画如下函数图像
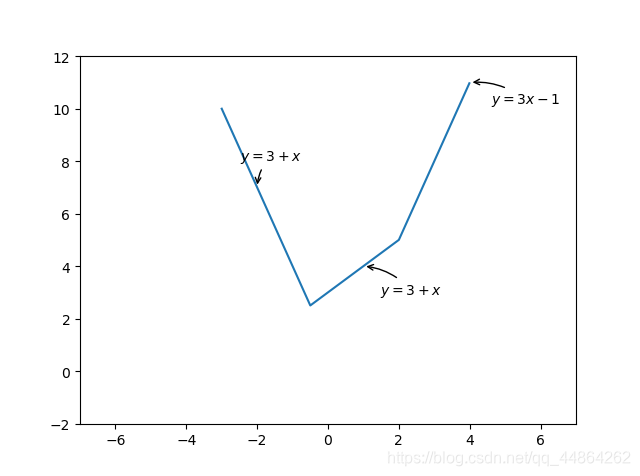
代码实现
import matplotlib.pyplot as plt
import numpy as np

t = np.arange(-3, 4, 0.01)
y_list = []  # 记录函数值


def y(t):
    for i in t:
        if i <= -1 / 2:
            y_list.append(-3 * i + 1)
        elif i >= 2:
            y_list.append(3 * i - 1)
        else:
            y_list.append(3 + i)


if __name__ == '__main__':
    y(t)
    plt.annotate(r'$y=3x-1$', xy=(4, 11), xytext=(+15, -15), textcoords='offset points', fontsize=10,
                 arrowprops=dict(arrowstyle='->', connectionstyle='arc3,rad=.2'))
    plt.annotate(r'$y=3+x$', xy=(1, 4), xytext=(+12, -20), textcoords='offset points', fontsize=10,
                 arrowprops=dict(arrowstyle='->', connectionstyle='arc3,rad=.2'))
    plt.annotate(r'$y=3+x$', xy=(-2, 7), xytext=(-12, +20), textcoords='offset points', fontsize=10,
                 arrowprops=dict(arrowstyle='->', connectionstyle='arc3,rad=.2'))
    plt.plot(t, y_list)
    plt.xlim(-7, 7)  # 坐标轴范围
    plt.ylim(-2, 12)
    plt.show()
    # plt.scatter(q, p, s=10, facecolors='none', edgecolors='r')
    # plt.show()
让我们加个坐标轴吧
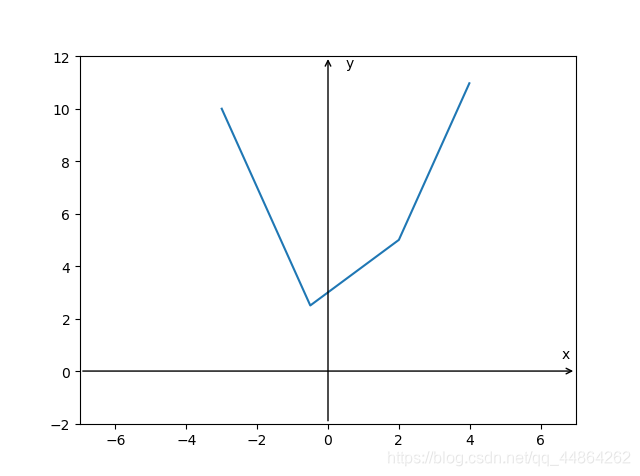
代码实现
import matplotlib.pyplot as plt
import numpy as np

t = np.arange(-3, 4, 0.01)
y_list = []  # 记录函数值


def y(t):
    for i in t:
        if i <= -1 / 2:
            y_list.append(-3 * i + 1)
        elif i >= 2:
            y_list.append(3 * i - 1)
        else:
            y_list.append(3 + i)


if __name__ == '__main__':
    y(t)
    plt.plot(t, y_list)
    plt.xlim(-7, 7)  # 坐标轴范围
    plt.ylim(-2, 12)

    x_np_list = np.arange(-7, 7, 0.01)
    y_list = [0] * len(x_np_list)  # 创建元素相同的列表
    plt.annotate("", xy=(7, 0), xycoords='data', xytext=(-7, 0), textcoords='data',
                 arrowprops=dict(arrowstyle="->", connectionstyle="arc3"))  # 画x轴
    plt.annotate("", xy=(0, 12), xycoords='data', xytext=(0, -2), textcoords='data',
                 arrowprops=dict(arrowstyle="->", connectionstyle="arc3"))  # 画y轴
    plt.text(6.6, 0.5, 'x')  # 标x
    plt.text(0.5, 11.6, 'y')  # 标y

    plt.show()
关于如何添加坐标轴请看为图像添加坐标轴方法。
还有一种用列表推导式,可以很快的把 的列表转换为 列表
y_np_list = np.array([y(t) for i in x_np_list])
关于列表推导式的应用请看列表推导式的应用