1.切换到istio根目录
cd /data/istio/istio-0.7.1
2.安装prometheus
kubectl apply -f install/kubernetes/addons/prometheus.yaml

3.创建收集数据的模板
# Configuration for metric instances
apiVersion: "config.istio.io/v1alpha2"
kind: metric
metadata:
name: doublerequestcount
namespace: istio-system
spec:
value: "2" # count each request twice
dimensions:
source: source.service | "unknown"
destination: destination.service | "unknown"
message: '"twice the fun!"'
monitored_resource_type: '"UNSPECIFIED"'
---
# Configuration for a Prometheus handler
apiVersion: "config.istio.io/v1alpha2"
kind: prometheus
metadata:
name: doublehandler
namespace: istio-system
spec:
metrics:
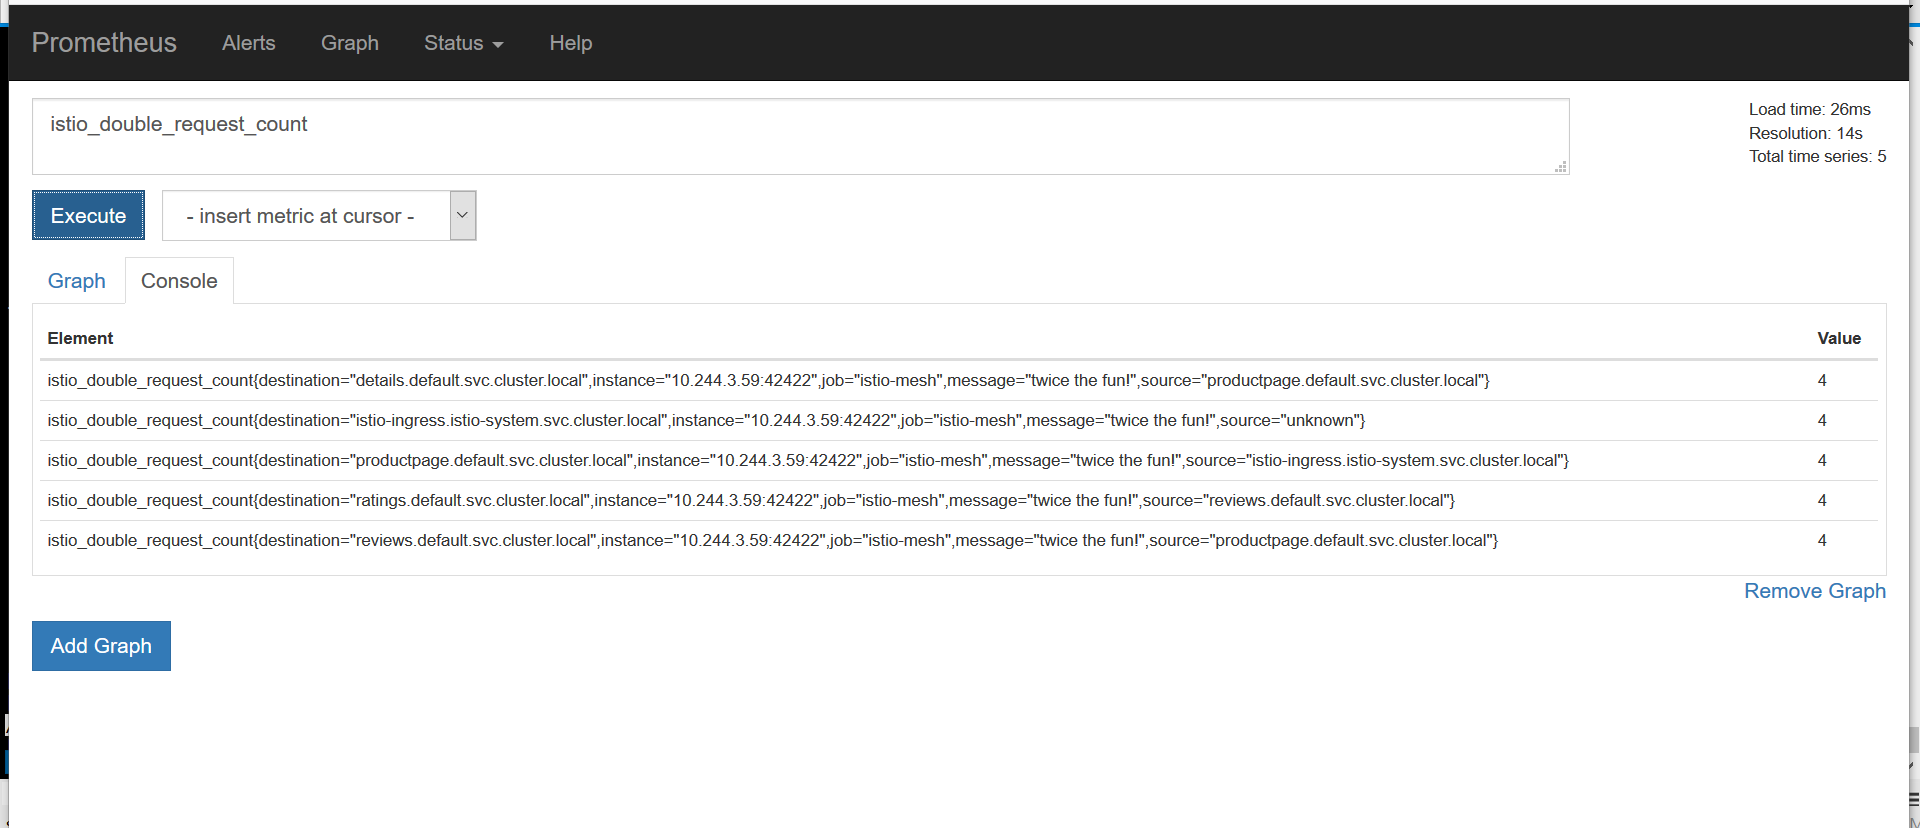
- name: double_request_count # Prometheus metric name
instance_name: doublerequestcount.metric.istio-system # Mixer instance name (fully-qualified)
kind: COUNTER
label_names:
- source
- destination
- message
---
# Rule to send metric instances to a Prometheus handler
apiVersion: "config.istio.io/v1alpha2"
kind: rule
metadata:
name: doubleprom
namespace: istio-system
spec:
actions:
- handler: doublehandler.prometheus
instances:
- doublerequestcount.metric
---
# Configuration for logentry instances
apiVersion: "config.istio.io/v1alpha2"
kind: logentry
metadata:
name: newlog
namespace: istio-system
spec:
severity: '"warning"'
timestamp: request.time
variables:
source: source.labels["app"] | source.service | "unknown"
user: source.user | "unknown"
destination: destination.labels["app"] | destination.service | "unknown"
responseCode: response.code | 0
responseSize: response.size | 0
latency: response.duration | "0ms"
monitored_resource_type: '"UNSPECIFIED"'
---
# Configuration for a stdio handler
apiVersion: "config.istio.io/v1alpha2"
kind: stdio
metadata:
name: newhandler
namespace: istio-system
spec:
severity_levels:
warning: 1 # Params.Level.WARNING
outputAsJson: true
---
# Rule to send logentry instances to a stdio handler
apiVersion: "config.istio.io/v1alpha2"
kind: rule
metadata:
name: newlogstdio
namespace: istio-system
spec:
match: "true" # match for all requests
actions:
- handler: newhandler.stdio
instances:
- newlog.logentry
---
# Configuration for a metric measuring bytes sent from a server
# to a client
apiVersion: "config.istio.io/v1alpha2"
kind: metric
metadata:
name: mongosentbytes
namespace: default
spec:
value: connection.sent.bytes | 0 # uses a TCP-specific attribute
dimensions:
source_service: source.service | "unknown"
source_version: source.labels["version"] | "unknown"
destination_version: destination.labels["version"] | "unknown"
monitoredResourceType: '"UNSPECIFIED"'
---
# Configuration for a metric measuring bytes sent from a client
# to a server
apiVersion: "config.istio.io/v1alpha2"
kind: metric
metadata:
name: mongoreceivedbytes
namespace: default
spec:
value: connection.received.bytes | 0 # uses a TCP-specific attribute
dimensions:
source_service: source.service | "unknown"
source_version: source.labels["version"] | "unknown"
destination_version: destination.labels["version"] | "unknown"
monitoredResourceType: '"UNSPECIFIED"'
---
# Configuration for a Prometheus handler
apiVersion: "config.istio.io/v1alpha2"
kind: prometheus
metadata:
name: mongohandler
namespace: default
spec:
metrics:
- name: mongo_sent_bytes # Prometheus metric name
instance_name: mongosentbytes.metric.default # Mixer instance name (fully-qualified)
kind: COUNTER
label_names:
- source_service
- source_version
- destination_version
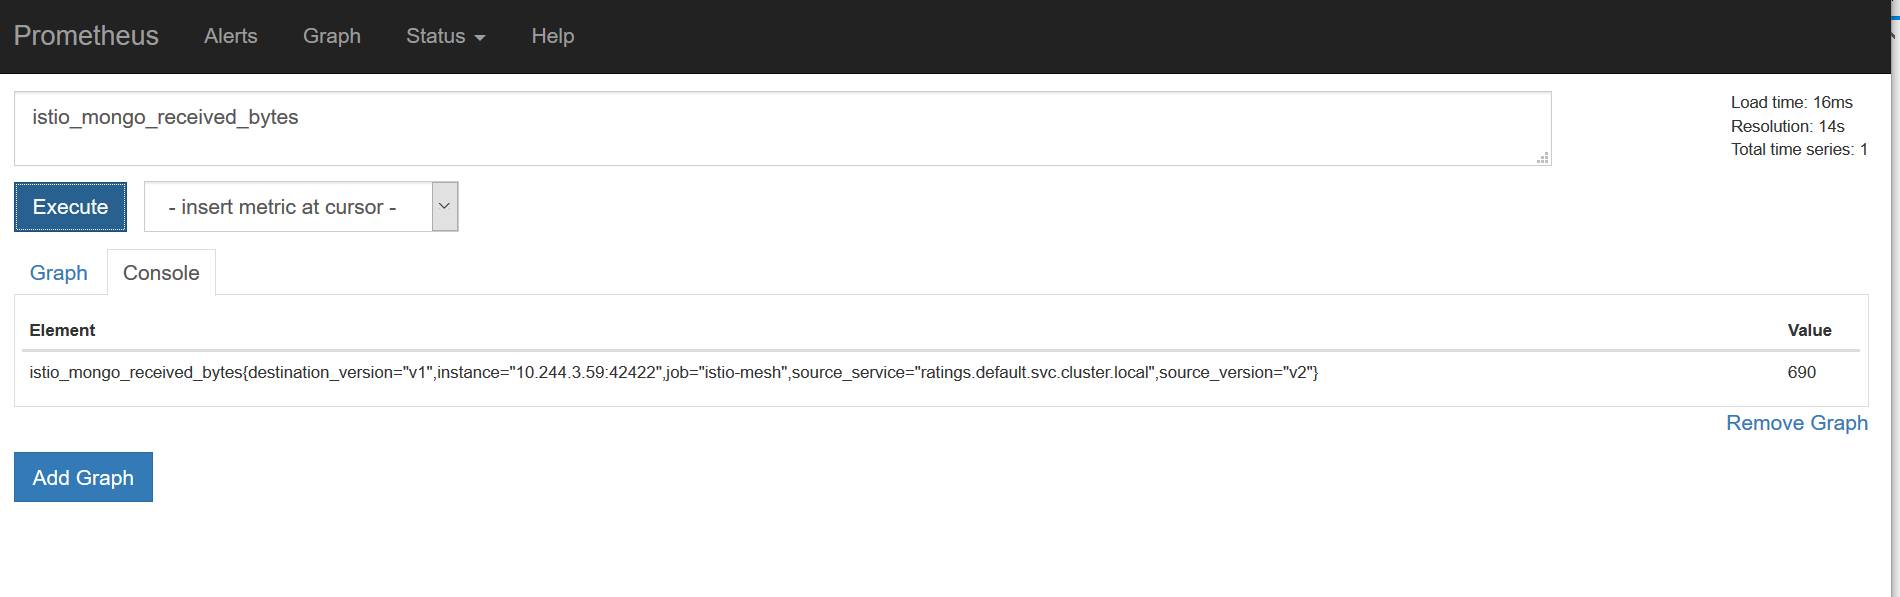
- name: mongo_received_bytes # Prometheus metric name
instance_name: mongoreceivedbytes.metric.default # Mixer instance name (fully-qualified)
kind: COUNTER
label_names:
- source_service
- source_version
- destination_version
---
# Rule to send metric instances to a Prometheus handler
apiVersion: "config.istio.io/v1alpha2"
kind: rule
metadata:
name: mongoprom
namespace: default
spec:
match: context.protocol == "tcp"
&& destination.service == "mongodb.default.svc.cluster.local"
actions:
- handler: mongohandler.prometheus
instances:
- mongoreceivedbytes.metric
- mongosentbytes.metric
执行命令:
istioctl create -f new_telemetry.yamlistioctl create -f tcp_telemetry.yaml为了测试支持收集tcp metric数据:
kubectl apply -f <(istioctl kube-inject -f samples/bookinfo/kube/bookinfo-ratings-v2.yaml)
kubectl apply -f <(istioctl kube-inject -f samples/bookinfo/kube/bookinfo-db.yaml)
istioctl create -f samples/bookinfo/kube/route-rule-ratings-db.yaml
4.测试
1)访问bookinfo事例
http://192.168.181.99:32693/productpage
2)查看prometheus ui