'''
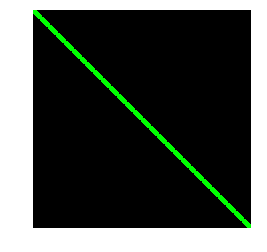
@brief Draws a line segment connecting two points.
The function line draws the line segment between pt1 and pt2 points in the image.
The line is clipped by the image boundaries. For non-antialiased lines with integer coordinates, the 8-connected or 4-connected Bresenham algorithm is used.
Thick lines are drawn with rounding endings. Antialiased lines are drawn using Gaussian filtering.
@param img Image.
@param pt1 First point of the line segment.
@param pt2 Second point of the line segment.
@param color Line color.
@param thickness Line thickness.
@param lineType Type of the line. See #LineTypes.
@param shift Number of fractional bits in the point coordinates.
'''
cv2.line(img, pt1, pt2, color[, thickness[, lineType[, shift]]])-> image
'''
@brief Draws a simple, thick, or filled up-right rectangle.
The function cv::rectangle draws a rectangle outline or a filled rectangle whose two opposite corners are pt1 and pt2.
@param img Image.
@param pt1 Vertex of the rectangle.
@param pt2 Vertex of the rectangle opposite to pt1 .
@param color Rectangle color or brightness (grayscale image).
@param thickness Thickness of lines that make up the rectangle. Negative values, like #FILLED, mean that the function has to draw a filled rectangle.
@param lineType Type of the line. See #LineTypes
@param shift Number of fractional bits in the point coordinates.
'''
cv2.rectangle(img, pt1, pt2, color[, thickness[, lineType[, shift]]])-> img
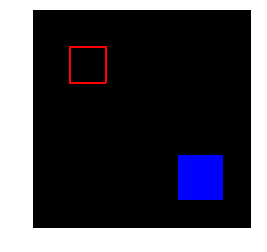
# 示例# 示例:绘制黑色背景板,在左上角绘制一个空心矩形,在右下角绘制一个实心矩形import numpy as np
import matplotlib.pyplot as plt
import cv2
image = np.zeros((300,300,3), dtype='uint8')# 创建图像数据,每个像素都为(0,0,0)
red =(255,0,0)
blue =(0,0,255)
cv2.rectangle(image,(50,50),(100,100), red,2)# 矩形左上角(50,50)、右下角(100,100),红色,线宽为2
cv2.rectangle(image,(200,200),(260,260), blue,-1)# 矩形左上角(200,200)、右下角(300,300),蓝色,矩形内部全部填充
plt.imshow(image)# 绘制图像
plt.axis("off")# 关闭坐标轴
plt.show()# 显示图像
圆
'''
@brief Draws a circle.
The function cv::circle draws a simple or filled circle with a given center and radius.
@param img Image where the circle is drawn.
@param center Center of the circle.
@param radius Radius of the circle.
@param color Circle color.
@param thickness Thickness of the circle outline, if positive. Negative values, like #FILLED, mean that a filled circle is to be drawn.
@param lineType Type of the circle boundary. See #LineTypes
@param shift Number of fractional bits in the coordinates of the center and in the radius value.
'''
cv2.circle(img, center, radius, color[, thickness[, lineType[, shift]]])-> img
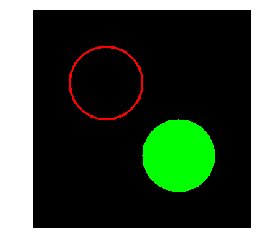
# 示例:绘制黑色背景板,以(100,100)为圆心绘制一个半径为50的红色空心圆,以(200,200)为圆心绘制一个半径为50的绿色实心圆import numpy as np
import matplotlib.pyplot as plt
import cv2
image = np.zeros((300,300,3), dtype='uint8')# 创建图像数据,每个像素都为(0,0,0)
red =(255,0,0)
green =(0,255,0)
cv2.circle(image,(100,100),50, red,2)# 圆心(100,100),半径50,红色,线宽为2
cv2.circle(image,(200,200),50, green,-1)# 圆心(200,200),半径50,绿色,圆内部填充
plt.imshow(image)
plt.axis("off")
plt.show()